

Working with data: tables and imports
Custom Tables are your own data tables inside Routario — invoices, shipments, products, support tickets, whatever your operation tracks. Flows can read rows, write rows, and loop over them. You define the columns; Routario stores and queries the data.
This guide covers creating tables, getting data in, and using them from automations.
What Custom Tables are for
Section titled “What Custom Tables are for”A Custom Table is a structured dataset you own inside Routario. You define its columns (text, number, date, and so on) and your flows populate and query it. Think of it as a lightweight spreadsheet that your automations can read and write without you touching it.
Use Custom Tables for data that Routario doesn’t already model — shipment statuses, internal product catalogues, incident logs, pricing sheets, delivery schedules. For contacts, companies, or deals, use the dedicated Contacts features instead.
Creating a table
Section titled “Creating a table”Go to Settings → Reference Data → Tables and create a new table. You have two starting points:
From a file. Upload a CSV or spreadsheet and Routario infers the columns from the header row. This is the fastest way to start — paste in an existing export and you’re done.
Blank. Add columns one by one and choose the type for each. Useful when you’re designing the schema from scratch before any data exists.
Decimal places on a number column
Section titled “Decimal places on a number column”A number column can say how many decimals it shows. Set Decimal places on the column (0 to 6), and every value in it is rounded and padded to that width.
It is worth doing on anything measured. A column left unset prints each value exactly as it was stored, so a file size column reads:
7.8 6.4 4.9 6.3 5.4 6 5.2 5.9That lone 6 is a stored 6.0 with nothing to round it, and a ragged column is one your eye cannot run down. Set it to one decimal and it reads 6.0 like the rest.
How many decimals a measurement has is a fact about the measurement rather than a preference of whoever is looking — which is why it lives on the column and applies everywhere the column appears. Leave it empty and nothing changes.
Long text: write answers straight into the table
Section titled “Long text: write answers straight into the table”Some text columns hold prose someone writes row by row — an answer to a customer question, a note, a paragraph of context. Open the column (Columns → Edit) and set Display to Long text (wraps, edit in the grid).
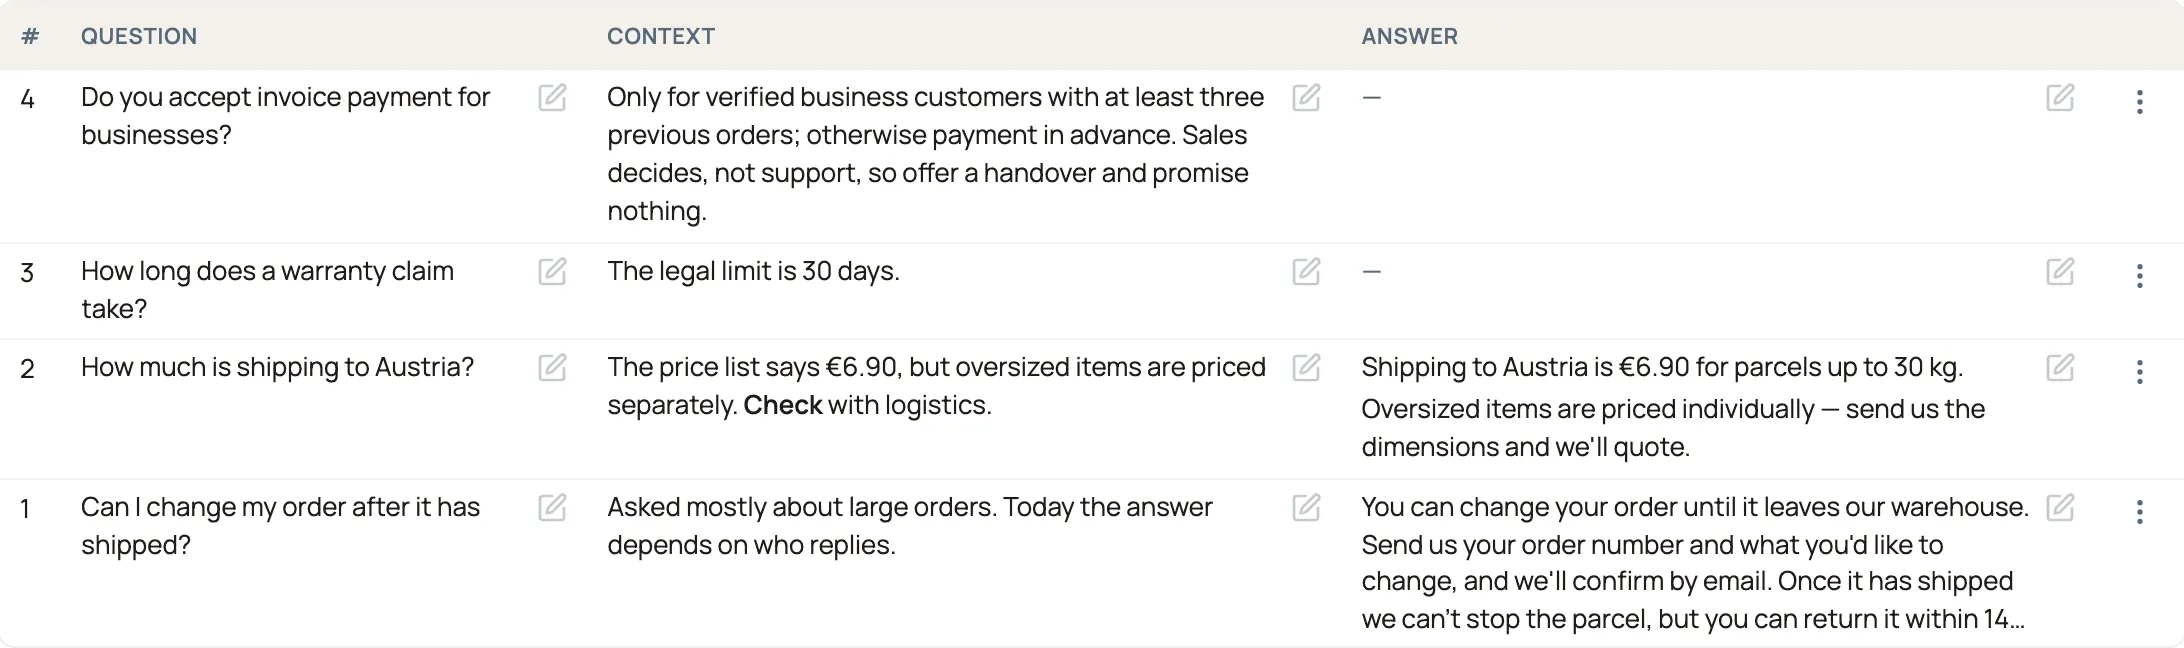
In the table, each value in that column then wraps to up to four lines and the row grows to fit. Click a cell — or Tab to it and press Enter — and it opens as a text box with the whole value in it, so this is also how you read an answer longer than four lines:
- Enter starts a new line.
- Click away, or press ⌘ Enter / Ctrl Enter, to save.
- Esc puts the value back the way it was.
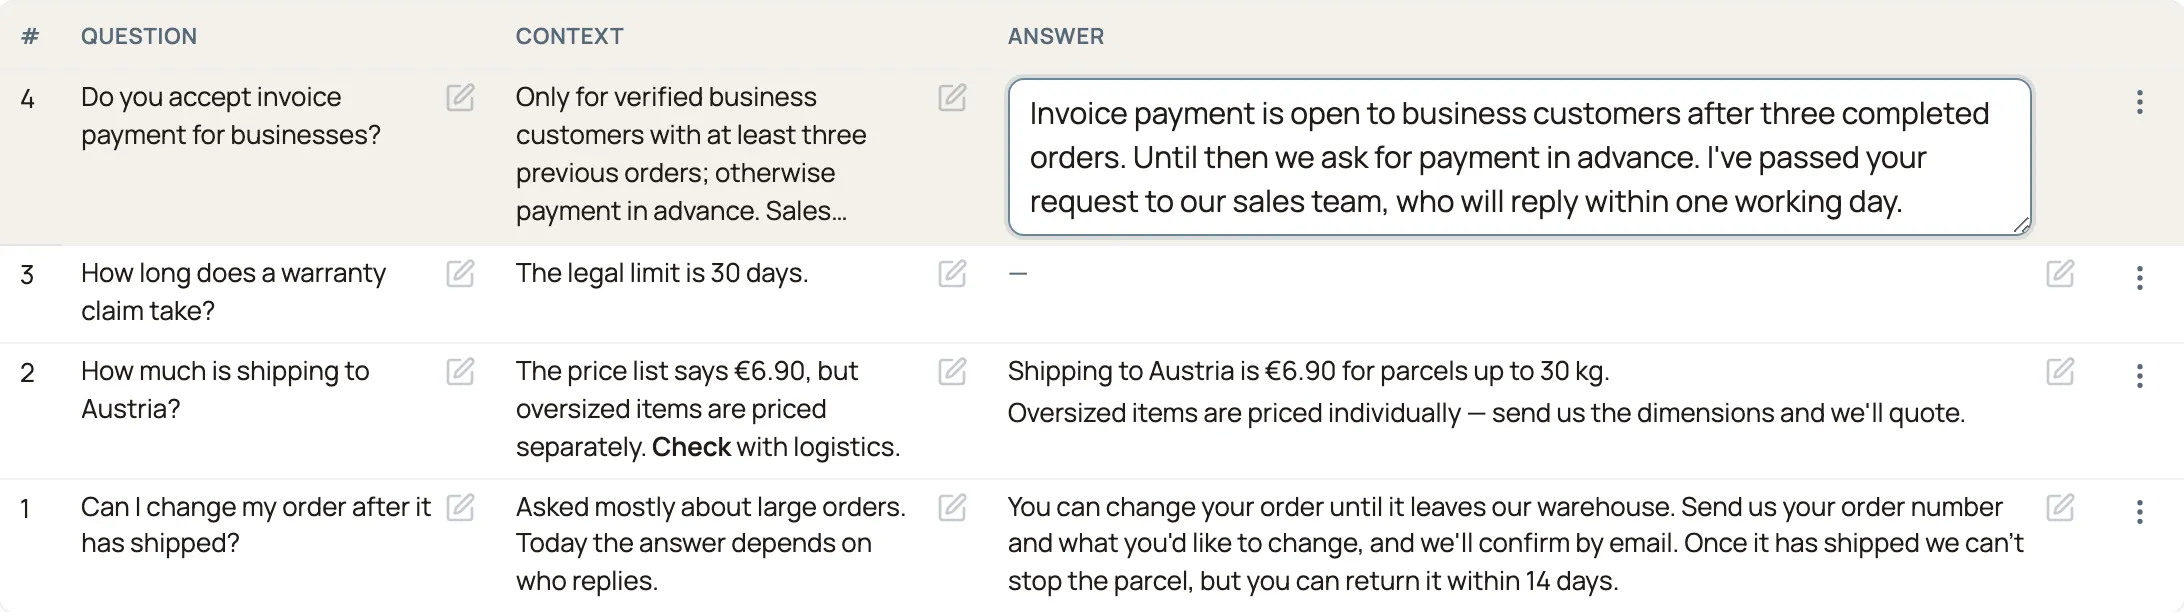
That replaces opening the row, switching to edit and saving it, which is three clicks and a page load for every answer. Formatting typed in the box (**bold**, a list) shows as formatting in the table, like any other text cell.
It is a display setting, not a data type: what is stored is the same plain text either way, so filters, sorting, exports, imports and calculated columns that read the column behave exactly as before. Switch it back to Short text and nothing about the data changes. Only text columns offer it, and not calculated ones, since nothing is stored to write into.
Getting data in
Section titled “Getting data in”Import a batch from a spreadsheet
Section titled “Import a batch from a spreadsheet”The Sync to Table step upserts a list of rows into a table in one operation. Give it a key column — a column whose value uniquely identifies a row, like an order number or product code — and it will update matching rows and insert new ones. Re-running the same flow with the same data produces no duplicates.
This is the right tool for a nightly or hourly sync: pull a fresh export, run it through Sync to Table, and your table stays current.
Sync to Table is column-tolerant: if your source has extra columns your table doesn’t define, they’re quietly dropped and listed in the dropped_keys output — useful for catching mapping mistakes. One bad row never aborts the batch; errors are counted and skipped.
Read rows from a spreadsheet first
Section titled “Read rows from a spreadsheet first”If the data comes in as an email attachment or uploaded file, add a Read spreadsheet step before Sync to Table. It turns an .xlsx, .xlsm, or .csv file into a list of rows keyed by the header row — rows[0].item_code, rows[0].quantity, and so on. Pass the rows output straight to Sync to Table.
Sync events from a calendar feed
Section titled “Sync events from a calendar feed”Calendar (iCal) fetches any iCalendar feed (Google Calendar, Outlook, Eventbrite, booking systems — anything with an .ics or webcal link) and returns its events as structured rows. Each event has a stable uid. Pair it with Sync to Table using key_column = uid and you get an idempotent calendar-to-table sync: re-run any time and only new or changed events land.
Schedule trigger (daily) → Calendar (iCal) url = your feed link, since = now, until = +30d → Sync to Table table = delivery_schedule, key_column = uidLand extracted documents into a table
Section titled “Land extracted documents into a table”When the data arrives as a document — an emailed invoice, a scanned delivery note — rather than a spreadsheet, you can pull its fields out and land them straight into a table. Extract reads an unstructured file into typed fields using a recipe; Ingest into Table writes those fields into the table the recipe is bound to, recording which document they came from and updating the matching row instead of duplicating when the same document arrives twice. If a document is low-confidence or doesn’t look right, Flag for review parks it on your inbox for a person to confirm or dismiss — nothing is written on a guess. Bind a recipe to the table once (Table → Ingestion recipe) and every flow just names the table.
A recipe can also check its own arithmetic — that a VAT base times its rate equals the VAT charged, that the parts sum to the header total — so a misread digit is caught before the row lands. See Check that extracted numbers add up.
Reading data in a flow
Section titled “Reading data in a flow”The Find records step returns rows from a table. Set a filter to match on a column value — { "status": "pending" } — or leave it empty to get all rows (up to the limit, which defaults to 100). The records output is a list you can pass to a For each loop.
Find records outputs a found flag. Wire your flow on it: if found is true, loop over the records and act on each; if false, send a notification or stop early. This is the standard pattern for “find matching rows, then do something per row.”
Find only the rows still waiting to be dealt with
Section titled “Find only the rows still waiting to be dealt with”The most useful filter is often “the ones nobody has handled yet”. Set a column’s value to null and Find records returns only rows where that column is empty:
{ "outcome": null }That’s the difference between asking for the ten rows that need you and fetching six hundred to pick them out. One live workspace’s nightly review went from pulling 195 rows to find 10, to pulling exactly the 10.
It combines with ordinary matches — every condition has to hold:
{ "outcome": null, "stage": "posted" }reads as “posted, and not yet given an outcome”.
Empty means genuinely empty, in all the ways a cell can be: never filled in, cleared, or blank.
This pairs naturally with a flow that marks rows as it goes: filter on the empty column, loop over what comes back, and write the column at the end of each pass. The next run picks up exactly where the last one stopped, with no bookkeeping of its own.
Ranges, lists and exclusions
Section titled “Ranges, lists and exclusions”For anything other than “equals”, give the column an operator object instead of a plain value:
| Operator | Means |
|---|---|
{"in": ["open", "pending"]} | any of these values (a bare list means the same) |
{"not_in": ["solved", "closed"]} | none of these — an empty cell counts as “not in” |
{"ne": "spam"} | differs from this value — an empty cell counts |
{"gt": 100}, {"gte": …}, {"lt": …}, {"lte": …} | greater / at least / less / at most. Numbers compare as numbers, dates (YYYY-MM-DD) in date order. An empty cell never matches |
{"is_null": true} / {"is_null": false} | the cell is empty / has a value |
{"contains": "brake"}, {"has": "C1"}, {"wildcard": "BRK-*"} | substring, one item of a comma-separated list, a */? pattern |
Several operators in one object must all hold, so a range is one object: {"day": {"gte": "2026-09-01", "lt": "2026-10-01"}}. Plain values and operator objects mix freely, and every column must hold:
{ "status": { "not_in": ["solved", "closed"] }, "mode": "live" }Values can be templated like any other field. The last 14 days is:
{ "mode": "live", "day": { "gte": "{{ now.date | minus_days(14) }}" } }now.date is today in your workspace’s timezone; minus_days (and plus_days, minus_months, …) shifts it. A per-column filter field in the step’s editor takes the same operator object as its text — type {"gte": "{{ now.date | minus_days(14) }}"} into the day field.
A filter on a column the table doesn’t have fails the step and names the real columns, rather than quietly finding nothing.
Return only some columns
Section titled “Return only some columns”Set columns to a list of column keys — ["mode", "day", "outcome"], or mode, day, outcome — and each record’s values holds just those. The row’s record_id and timestamps are always there. Leave it empty for every column. Keeping it narrow matters when the records feed an AI step or a long loop.
Writing from a flow
Section titled “Writing from a flow”Three steps cover single-row writes:
Create Record adds one row and returns its record_id. By default it always inserts — use it to accumulate data across runs, like logging an event, recording an incoming lead, or appending a metric. Turn on Update if it already exists to update a matching row instead of duplicating it — see Update or insert a single row below.
Update Record patches an existing row by record_id. Only the columns you include in values change; everything else is untouched. Use it to change a status field, bump a counter, or fill in a column a later step computed — reach for it when you already hold the row’s id (say, from a Find records loop). To change every row that matches a condition, give it a table, a filter (the same column → value object Find records takes; null matches an empty column) and a limit instead of a record_id: each matching row is updated — newest first, at most limit — and recorded in the row history exactly as a single update is. updated_ids lists the rows it changed. That replaces “find the rows, loop, update each one”. An empty filter is refused rather than treated as “every row”.
Get Record fetches one row by record_id — useful when you already hold the id and want to re-read the current values before deciding whether to update. Returns a found flag the same way Find records does.
Update or insert a single row
Section titled “Update or insert a single row”Often a flow needs to keep one row current — one record per order, per customer, per sprint — and re-run without piling up duplicates. That’s an upsert: update the row if it’s already there, insert it if it isn’t.
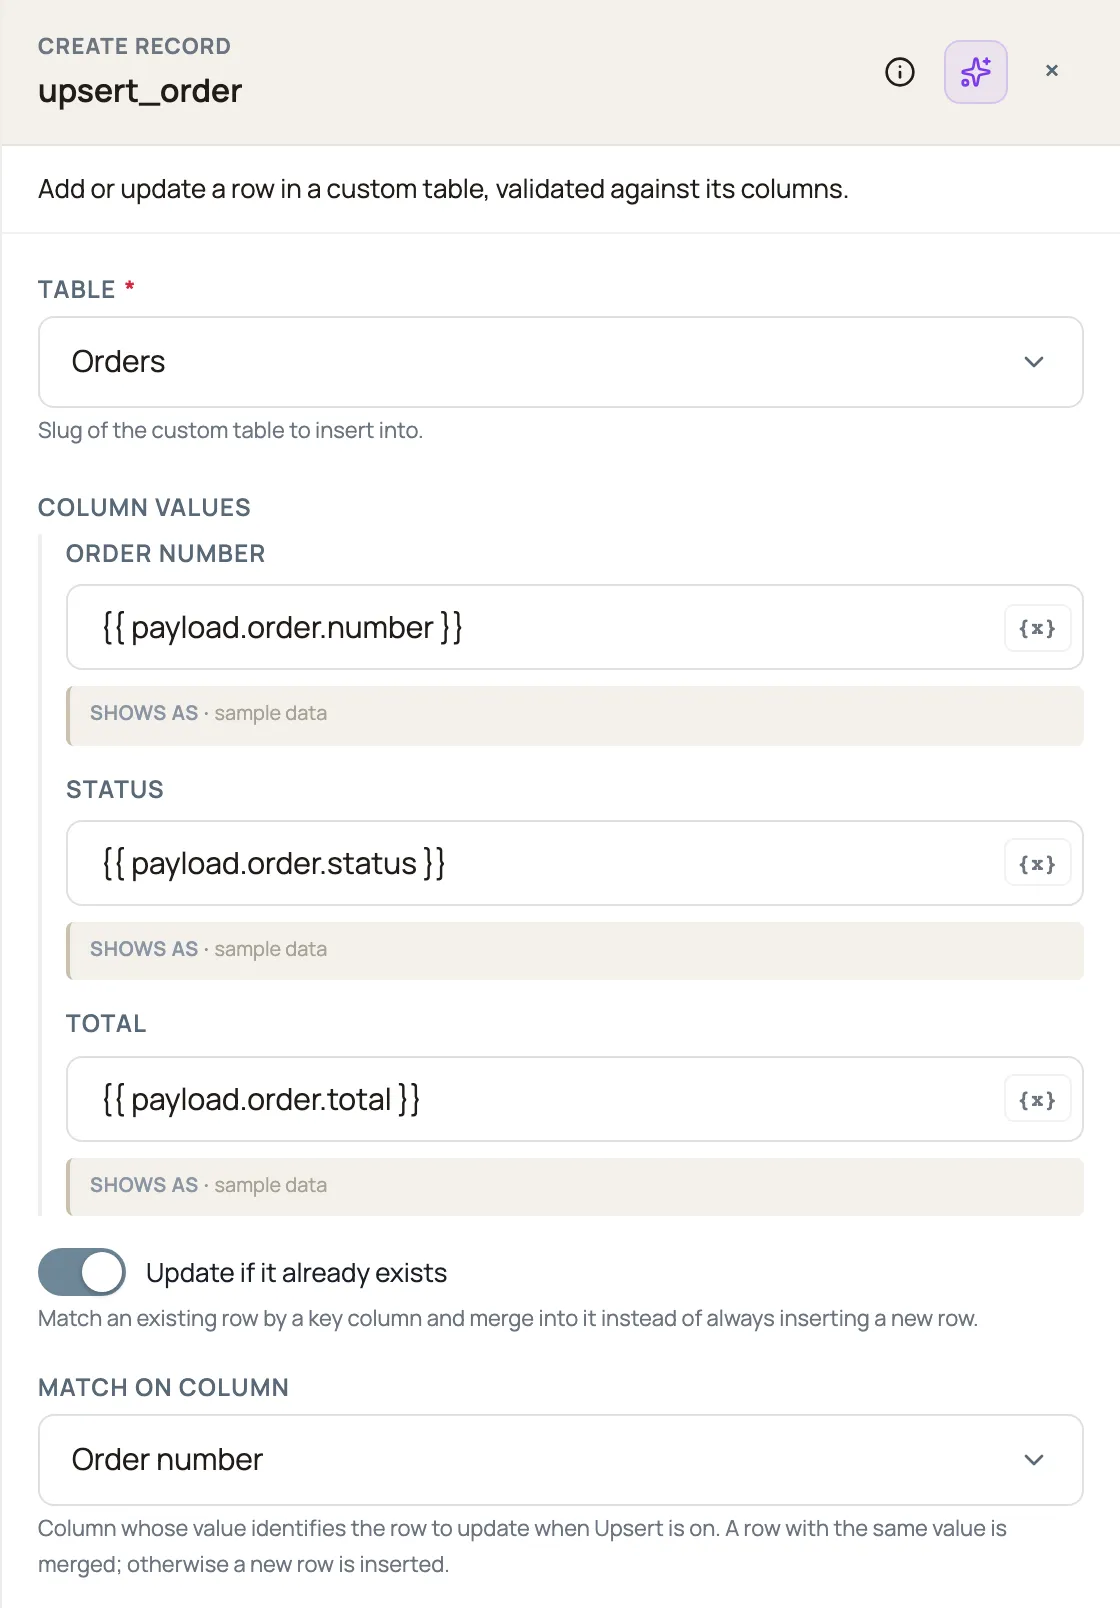
Create Record does this in one step. Turn on Update if it already exists and pick a Match on column — the column whose value identifies the row, like order_number or cycle. On each run:
- If a row already has that value, Create Record merges your new values into it: the columns you provide win, and columns you leave out keep their old values.
- If no row matches, it inserts a new one.
The created output tells you which happened — true for a fresh insert, false for a merge — so a later step can branch on “was this new?”.
Worked example — one row per order from a webhook. An incoming webhook sends an order update, and you want your orders table to hold exactly one row per order_number, refreshed each time an update arrives:
Incoming webhook → Create Record table = orders Update if it already exists = on Match on column = order_number order_number = {{ payload.order.number }} status = {{ payload.order.status }} total = {{ payload.order.total }}Re-send the same order and its one row updates in place — no duplicates. This is the single-row counterpart to the batch sync above: Sync to Table upserts a whole list of rows keyed by a column; Create Record upserts one.
Links and files on rows
Section titled “Links and files on rows”Two column types carry more than plain values:
Link. A validated web address, rendered as a clickable link in the grid. Paste it with or without the scheme — example.com/report is stored as https://example.com/report — and anything that isn’t a single well-formed http(s) URL is rejected at save time, so a link cell always opens.
Attachment. A file pinned to a row — a delivery evidence photo, a signed slip, an invoice PDF. Image attachments show as a thumbnail in the grid (click for the full image); other files show as a named file link. The bytes live in Memory as a normal document — deduplicated, searchable, and covered by the same access rules — and the cell holds a pointer to it.
Three ways an attachment gets onto a row:
- In the app. The add-row and edit-row forms show a file picker for attachment columns. Choosing a new file replaces the current one; leaving it empty keeps what’s there.
- From a flow. Set the column’s value to a document id — typically the
document_idoutput of a Save to memory step earlier in the flow. - From outside. A device that can only reach a flow’s webhook can send the file as base64 inside the trigger JSON: a Save to memory step stores it (
content_base64+filenameinputs) and a Create Record step writes the resulting{{ document_store.document_id }}into the attachment column. Webhook bodies are capped at 1 MB of JSON, so keep an inline photo under roughly 700 kB of raw bytes — or push larger files through the API instead.
Worked example: daily shipment sync and action flow
Section titled “Worked example: daily shipment sync and action flow”This example uses two automations. The first keeps the table fresh; the second acts on today’s rows.
Automation 1 — nightly import
Section titled “Automation 1 — nightly import”- Schedule trigger. Set to run every night at 01:00.
- Read spreadsheet. Point it at the shipments export file (delivered earlier by email or placed in a known path). It outputs a
rowslist. - Sync to Table. Table =
shipments, rows ={{ read_spreadsheet.rows }}, key column =shipment_id. Rows are upserted; nothing duplicates on re-run.
Automation 2 — morning action run
Section titled “Automation 2 — morning action run”- Schedule trigger. Set to run every morning at 07:00.
- Find records. Table =
shipments, filter ={ "dispatch_date": "{{ now.date }}", "status": "pending" }. Label this steptodays_shipments. - Branch. If
{{ todays_shipments.found }}is false, send a notification (“No shipments due today”) and stop. - For each over
{{ todays_shipments.records }}. Inside the loop:- Do whatever the shipment needs — send a carrier API call, notify a driver, post to a webhook.
- Update Record. Set
record_id = {{ loop.item.record_id }}andvalues = { "status": "dispatched" }so the row is marked done.
Recovering deleted rows and tables
Section titled “Recovering deleted rows and tables”Deleting a row or a table in Routario is reversible. Nothing is erased on the spot — deleted rows and tables are hidden and kept in a Trash, so an accidental delete (yours, a teammate’s, or an automation’s) is a quick undo rather than a lost afternoon.
Restore a deleted row
Section titled “Restore a deleted row”When you delete a row (its menu calls the action Archive row), it disappears from the table but moves to that table’s Trash.
Open the table and look for the Trash button in the top-right actions — it shows a count when there’s anything to recover. Click it to see the deleted rows, each with the columns it had and when it was deleted. Hit Restore on a row and it returns to the table exactly as it was.
Restore a whole table
Section titled “Restore a whole table”Deleting a table hides it and its rows, but keeps every row intact underneath. To bring one back, go to Settings → Reference Data → Tables and click the Trash button there. You’ll see the deleted tables, each showing how many rows come back with it. Restore returns the table and all of its data.
See who deleted what
Section titled “See who deleted what”Every delete and every restore is recorded on the Logs page (Settings → Logs, in the Changes lens) with the person or automation that did it, what it touched, and how many rows — so a table that suddenly went empty has a plain answer: “a user called ‘agent’ deleted 17 rows two hours ago.” Deletes done by an automation are attributed to that automation, so you can always tell a person’s action from a flow’s.
Worked example — an automation cleared a table by mistake. You open a table and it’s empty. Rather than guessing, check the Logs page: it shows the delete, who or what did it, and the row count. Open the table’s Trash, and the rows are sitting right there — Restore them and you’re back to where you were, with a record of what happened.
Browsing a big table
Section titled “Browsing a big table”The table page shows one page of rows at a time — 50 by default, with a ‹ › pager and an honest range under the grid (“51–100 of 4 312”). The count is always over the whole table, never over what happens to be on screen, so it tells you how much is there rather than how much fits.
Four controls make a long table usable:
- Search — the box above the grid looks for your text in every text column at once, so you don’t have to know which one holds it. “ABC-123” finds the row whether the reference is in the title or buried in the notes.
- Sort — click a column heading. The arrow shows the direction; clicking the same heading again reverses it. Sorting orders the entire table and then pages it, so the top of an ascending sort really is the smallest value, not the smallest value on page 1.
- Filter — the + Filter button above the grid narrows the rows by any column: text contains, a number or date range, one or more picklist values, a yes/no column, or — for a column holding a file or a link to another record — whether it has one at all (“Photo: Missing” finds the rows still waiting for evidence). Filters combine with AND, and each one appears as a chip you can click to remove. The row count and the summary footer both follow the filter, so a filtered total is a real total of the filtered set.
- Page size — add
?per_page=200to the URL to show more rows at once (200 is the maximum).
All of it lives in the URL, so a filtered, sorted page is a link you can bookmark or paste to a colleague — and none of it is saved to the table. That’s the difference from a view: a filter you set here is yours for as long as you’re looking at it, while a view is a saved, named tab that everyone with access sees.
If what you’ve narrowed down turns out to be worth keeping, Save as view (above the grid, once you’ve applied something) opens the view editor with your filters and sort already in it. You name it and save, and it becomes a tab like any other. It opens the editor rather than saving straight off on purpose: a view is written in its own filter language, and you should see its version of what you asked for before it becomes something your colleagues read. A search across columns is kept but shown as a plain line — the editor can’t take one apart, so it holds it as-is rather than dropping it.
Filtering, grouping, and summarizing without a flow
Section titled “Filtering, grouping, and summarizing without a flow”Everything above is about getting rows in and reading them from a flow. If what you actually want is an ad-hoc breakdown — “cars by color, last 24 hours” — you don’t need either: build a saved view directly on the table. See Filter, group, and summarize a table for filtering, grouping, real totals over the full table, and reusing the same view as a dashboard chart.
Custom Tables over the API
Section titled “Custom Tables over the API”Custom Tables are also readable and writable over the Routario API. Use the API to push rows from an external system, pull a table’s contents into another tool, or build a lightweight integration without building a full automation.
Where to go next
Section titled “Where to go next”- Building an automation — triggers, steps, data flow, and the canvas explained from scratch.
- Filter, group, and summarize a table — saved views: filter, group-by, real totals, and dashboard charts, no flow required.
- Create Record reference — every field, including the upsert toggle and match column.
- Sync to Table reference — full field documentation for batch upserts, key columns, and error handling.
- Routario API — read and write tables from outside Routario.