

Calculate a column from other columns
You have the raw numbers. Your support table counts tickets seen and tickets answered; your deals table counts won and lost. What you actually want to look at is the percentage — and that number is nowhere, because nobody typed it.
You have three bad options and one good one. You could type it in by hand and watch it drift the moment a row changes. You could build a flow to write it back. Or you could ask the chart to do the arithmetic, which charts deliberately don’t.
The good option is a calculated column: a small formula stored on the column itself, worked out fresh every time a row is read. Nothing is saved, so nothing can go stale.
The example
Section titled “The example”A table tracking a support copilot’s daily work, with two counted columns:
| Day | Tickets seen | Answered |
|---|---|---|
| Mon | 48 | 40 |
| Tue | 30 | 24 |
| Wed | 11 | 0 |
Add one more column, Coverage %, with this formula:
{{ ((answered / tickets_seen) * 100) | round }}| Day | Tickets seen | Answered | Coverage % |
|---|---|---|---|
| Mon | 48 | 40 | 83 |
| Tue | 30 | 24 | 80 |
| Wed | 11 | 0 | 0 |
Change Answered on Monday and Coverage % changes with it, on the next read. There is no recalculation step and no backfill, because there is nothing stored to be out of date.
Adding one
Section titled “Adding one”Go to Settings → Reference Data → Tables, open a table, and click Columns. Add a column (or edit an existing one) and fill in the box labelled Computed from other columns.
Refer to your other columns by their key — the short lowercase name in the Key column of the list, like tickets_seen, not the friendly label “Tickets seen”. Wrap the whole thing in {{ }}.
Leave the box empty and you get an ordinary column that people and automations write to, exactly as before. Clearing the formula on a calculated column turns it back into an ordinary one.
Watch it run before you save it
Section titled “Watch it run before you save it”Under the formula box is a live preview that renders against a real row from your table, with arrows to step through rows.
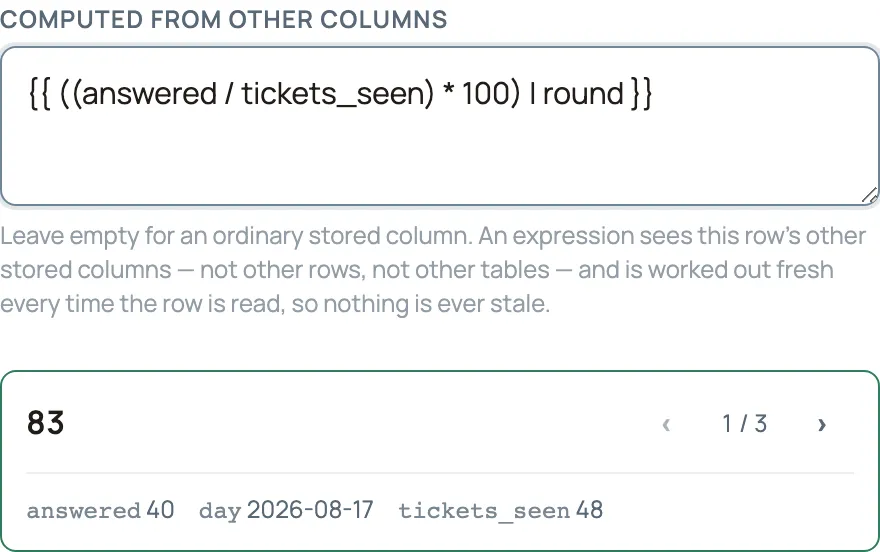
This matters more than it sounds. Consider these two formulas:
{{ (won + lost / lost * 100) | round }}{{ (won / (won + lost) * 100) | round }}Both are valid. Only the second one is a percentage — the first quietly works out to won + 100, because division happens before addition. No amount of checking catches that; seeing 103 where you expected 30 catches it instantly. Use the brackets, and look at the preview.
The preview answers two separate questions:
- “This would not save” — the formula breaks a rule, whatever row you point it at. Fix it before saving.
- A value, or
(blank)with a reason — what this particular row produces. Blank is often the right answer, so the preview always tells you why it happened.
Blank is a real answer
Section titled “Blank is a real answer”When a formula can’t produce a number, the cell is blank. Not zero, not an error, not the formula text.
That’s deliberate. On Wednesday, if nothing had been scored yet, answered / tickets_seen would be dividing by nothing. Showing 0% would be a lie — it reads as “we answered none of them”, when the truth is “there was nothing to answer”. Blank says no answer, which is what you mean.
Two everyday causes:
- Dividing by zero or by an empty cell.
- A cell that has never been filled in.
Empty cells that should count as zero
Section titled “Empty cells that should count as zero”A counter that never went up isn’t stored as 0 — it simply isn’t there. So answered on a quiet day may be missing rather than zero, and the whole formula goes blank.
Write | default(0) on the part that should count as zero:
{{ (((answered | default(0)) / tickets_seen) * 100) | round }}Put it on the top of the fraction, not the bottom. They mean different things:
- An empty top is a real zero — nothing happened, so the answer is
0%. - An empty bottom is no basis for a percentage at all — that one should stay blank.
Rounding, and other tidying
Section titled “Rounding, and other tidying”round is written after a pipe, not as a function:
{{ (won / (won + lost) * 100) | round }} ✅{{ round(won / (won + lost) * 100) }} ❌Rounding down or up uses the same pipe: | round(0, 'floor') and | round(0, 'ceil'). Routario tells you this by name if you get it wrong, before you can save.
You can also do text and yes/no columns, not just arithmetic:
{{ first_name }} {{ last_name }}{{ amount > 1000 }}{{ 'Overdue' if due_date < now.date else 'On time' }}now.date is today’s date in your workspace’s timezone, so an “overdue” column stays correct without anything re-running.
What a formula can see
Section titled “What a formula can see”The row it’s on, and nothing else. Every other column of that row is available by key.
It cannot reach other rows, other tables, or a total across the table. That’s the boundary that keeps calculated columns fast and predictable — if you need “compare this row to the average”, that’s a view or a chart, not a column.
One more rule worth knowing: a calculated column can only use ordinary stored columns, not another calculated one. If two formulas need the same piece of arithmetic, repeat it in both. That keeps every formula readable on its own, with no chain to trace when a number looks wrong.
A calculated column also can’t be marked Required — nobody fills it in, so there’d be nothing to require.
What you can do with the result
Section titled “What you can do with the result”A calculated column behaves like any other column once it exists. You can:
- Chart it — plot Coverage % over time, or average it by group.
- Filter, group, and sort by it — “show me only days under 50%”.
- Export it — it appears in CSV and Excel downloads with everything else.
- Read it from a flow —
record_listandrecord_getreturn it like any other field.
The one thing you can’t do is write to it. It isn’t a field on the add-row or edit-row form, imports won’t map onto it, and a flow that tries to set it is ignored. The formula is the only thing that decides its value.
Where to go next
Section titled “Where to go next”- Working with data: tables and imports — creating tables, columns, and getting rows in.
- Filter, group, and summarize a table — answer questions across rows, once you have the columns you need.
- Chart a table and build a dashboard — put a calculated percentage on a dashboard.