

Filter, group, and summarize a table
Sometimes you don’t need an automation, you need an answer: how many cars were red last week? what’s the average ticket value by status? Building a flow for a one-off breakdown is overkill. Views answer this directly on the table itself — filter, group, and summarize your rows, save the result as a tab, and put it on a dashboard.
This guide covers building a view by hand, describing one in plain English instead, and what a view is (and isn’t) good for.
What a view is
Section titled “What a view is”A view is a saved way of looking at one Custom Table: a set of filters, an optional group-by, and optional summary numbers. Every table already has one view for free — All rows, the plain grid with nothing filtered or grouped. Anything else you save (Cars by color, Open tickets this week) shows up as an extra tab next to it.
Views are addressed as table.view — the bare table name always means “all rows”; a saved view adds its own slug after a dot. You don’t need to think about this address directly, it’s just the shape a link like /tables/cars?tab=cars_by_color takes.
Two shapes come out of the same view:
- A row view (no grouping) — the filtered rows themselves, with an optional summary footer under the last row (a count, sum, or average per column, computed over every matching row, not just what’s on screen).
- A grouped view (grouping turned on) — one row per group instead of one row per record, with a metric column per group (count, sum, average, minimum, maximum, or distinct count) and a Total row underneath that’s a real aggregate over the whole matching set, not a sum of the visible groups.
Both run as one SQL query over your entire table — filtering and grouping are never limited to whatever page of rows happens to be on screen. A “last 24 hours” filter or a group-by-color count is exact even on a table with tens of thousands of rows.
Building a view
Section titled “Building a view”Open a table and click + New view next to the saved-view tabs. You get three controls, Notion/Airtable style:
- Filter — pick a column, an operator, and a value. Add as many as you like; they’re all combined with AND (there’s no OR or nested grouping — see What views don’t do below). The operators on offer depend on the column’s type — see Which operators a column gets below.
- Group by — pick a column to group on. Group by a date or datetime column and a bucket option appears — more on that below.
- Summarize — pick one or more metrics (count, sum, average, minimum, maximum, distinct count) once you’ve set a group-by.
Whatever you build, an always-on plain-English sentence above the results tells you exactly what the view shows — for example:
Cars where Color is not Unknown and Detected at in the last 24 hours, grouped by Color (count).
This line updates live as you edit the filter/group/summarize controls, and it’s shown to anyone looking at the view, whether they built it or not — so nobody has to reverse-engineer a saved view’s filters from the results.
Name the view and save it, and it appears as a new tab. Anyone with access to the table can switch between tabs; each one keeps its own filters.
Which operators a column gets
Section titled “Which operators a column gets”You never pick an operator a column can’t answer — the list is built from the column’s
type, so a date column never offers contains and a text column never offers between.
| Column type | Operators |
|---|---|
| Text, Link | is, is not, contains, is empty, is not empty |
| Choice | is, is not, is any of, is none of, is empty, is not empty |
| Number | =, ≠, >, <, ≥, ≤, between, is empty, is not empty |
| Date, Date & time | on or after, on or before, before, after, between, in the last N, is empty, is not empty |
| Yes/no | is, is empty |
| Attachment | is empty, is not empty |
Two of those are worth calling out.
on or after / on or before are the inclusive pair, and they’re what you usually
mean. “From the 1st” includes the 1st. before and after are strict — a real
question, just rarely the one a typed date range is asking. On a date & time
column, on or before the 20th covers the whole of the 20th, not just midnight.
is empty / is not empty ask whether the cell was filled in at all. They take no
value — the value box disappears when you pick one. This is how you answer “which
tickets have we actually replied to?” (Replied on is not empty) or “which deals have
no owner?” without inventing a sentinel date like 1900-01-01.
Describe it in plain English instead
Section titled “Describe it in plain English instead”If you’d rather not click through the filter builder, type what you want into the Describe what you want box in the view editor — “cars by color in the last week, excluding unknown” — and Routario drafts the filter, group-by, and metrics for you. The draft lands in the same editor as an ordinary set of filter chips: nothing is saved until you review it and hit Save. If the request doesn’t parse into something the compiler can run, you get an empty draft to build on by hand instead — the AI step never silently guesses at something it isn’t sure about.
Grouping by time: two different questions
Section titled “Grouping by time: two different questions”Grouping a date or datetime column offers two families of bucket, because “by day” and “by day of week” answer different questions:
- Sequential buckets —
hour,day,week,month— plot a timeline. Each bucket is one specific point in time (this Tuesday, not Tuesdays in general), so a chart of these only has bars for periods where something actually happened. - Cyclic buckets —
hour of day,day of week,month of year— collapse the whole timeline into a repeating cycle. “Traffic by hour of day” answers “what does a typical day look like”, not “what happened on any specific day.” Because the question is about the shape of the cycle, cyclic buckets always show every slot in the cycle — all 24 hours, all 7 weekdays, all 12 months — even the ones with zero matching rows, so the shape reads correctly instead of looking like missing data.
Per-column display
Section titled “Per-column display”Each saved view can also control, per column, whether it’s shown at all and how its value is displayed — independent of the raw stored value:
- Hide columns you don’t need cluttering this particular view.
- Dates and times default to your workspace’s timezone, or you can switch a column to UTC, relative (“3 min ago”), date-only, or time-only.
- Numbers default to their raw value, or you can render a column as a percent, a fixed 2-decimal number, or a rounded integer.
These are per-view, per-column settings — the same underlying table can show a date as “3 min ago” on one saved view and as a plain UTC timestamp on another. Column widths and order work the same way; see the next section.
Column widths and order
Section titled “Column widths and order”A table lays itself out from what each column holds: numbers, dates and short values stay on one line, text wraps at a readable width, and the table is only as wide as its columns. Most of the time that is all you need. When it isn’t, arrange the columns by hand:
- Resize — drag the right edge of a column heading. The text in the column re-wraps as you drag.
- Reorder — drag a column heading left or right and drop it where you want it.
- Auto-fit — double-click a column’s right edge to let that column size itself again. To reset every column at once, use the Auto-fit columns button (the ↔ icon) in the top-right corner of the heading row. It only appears while the view has a width someone dragged.
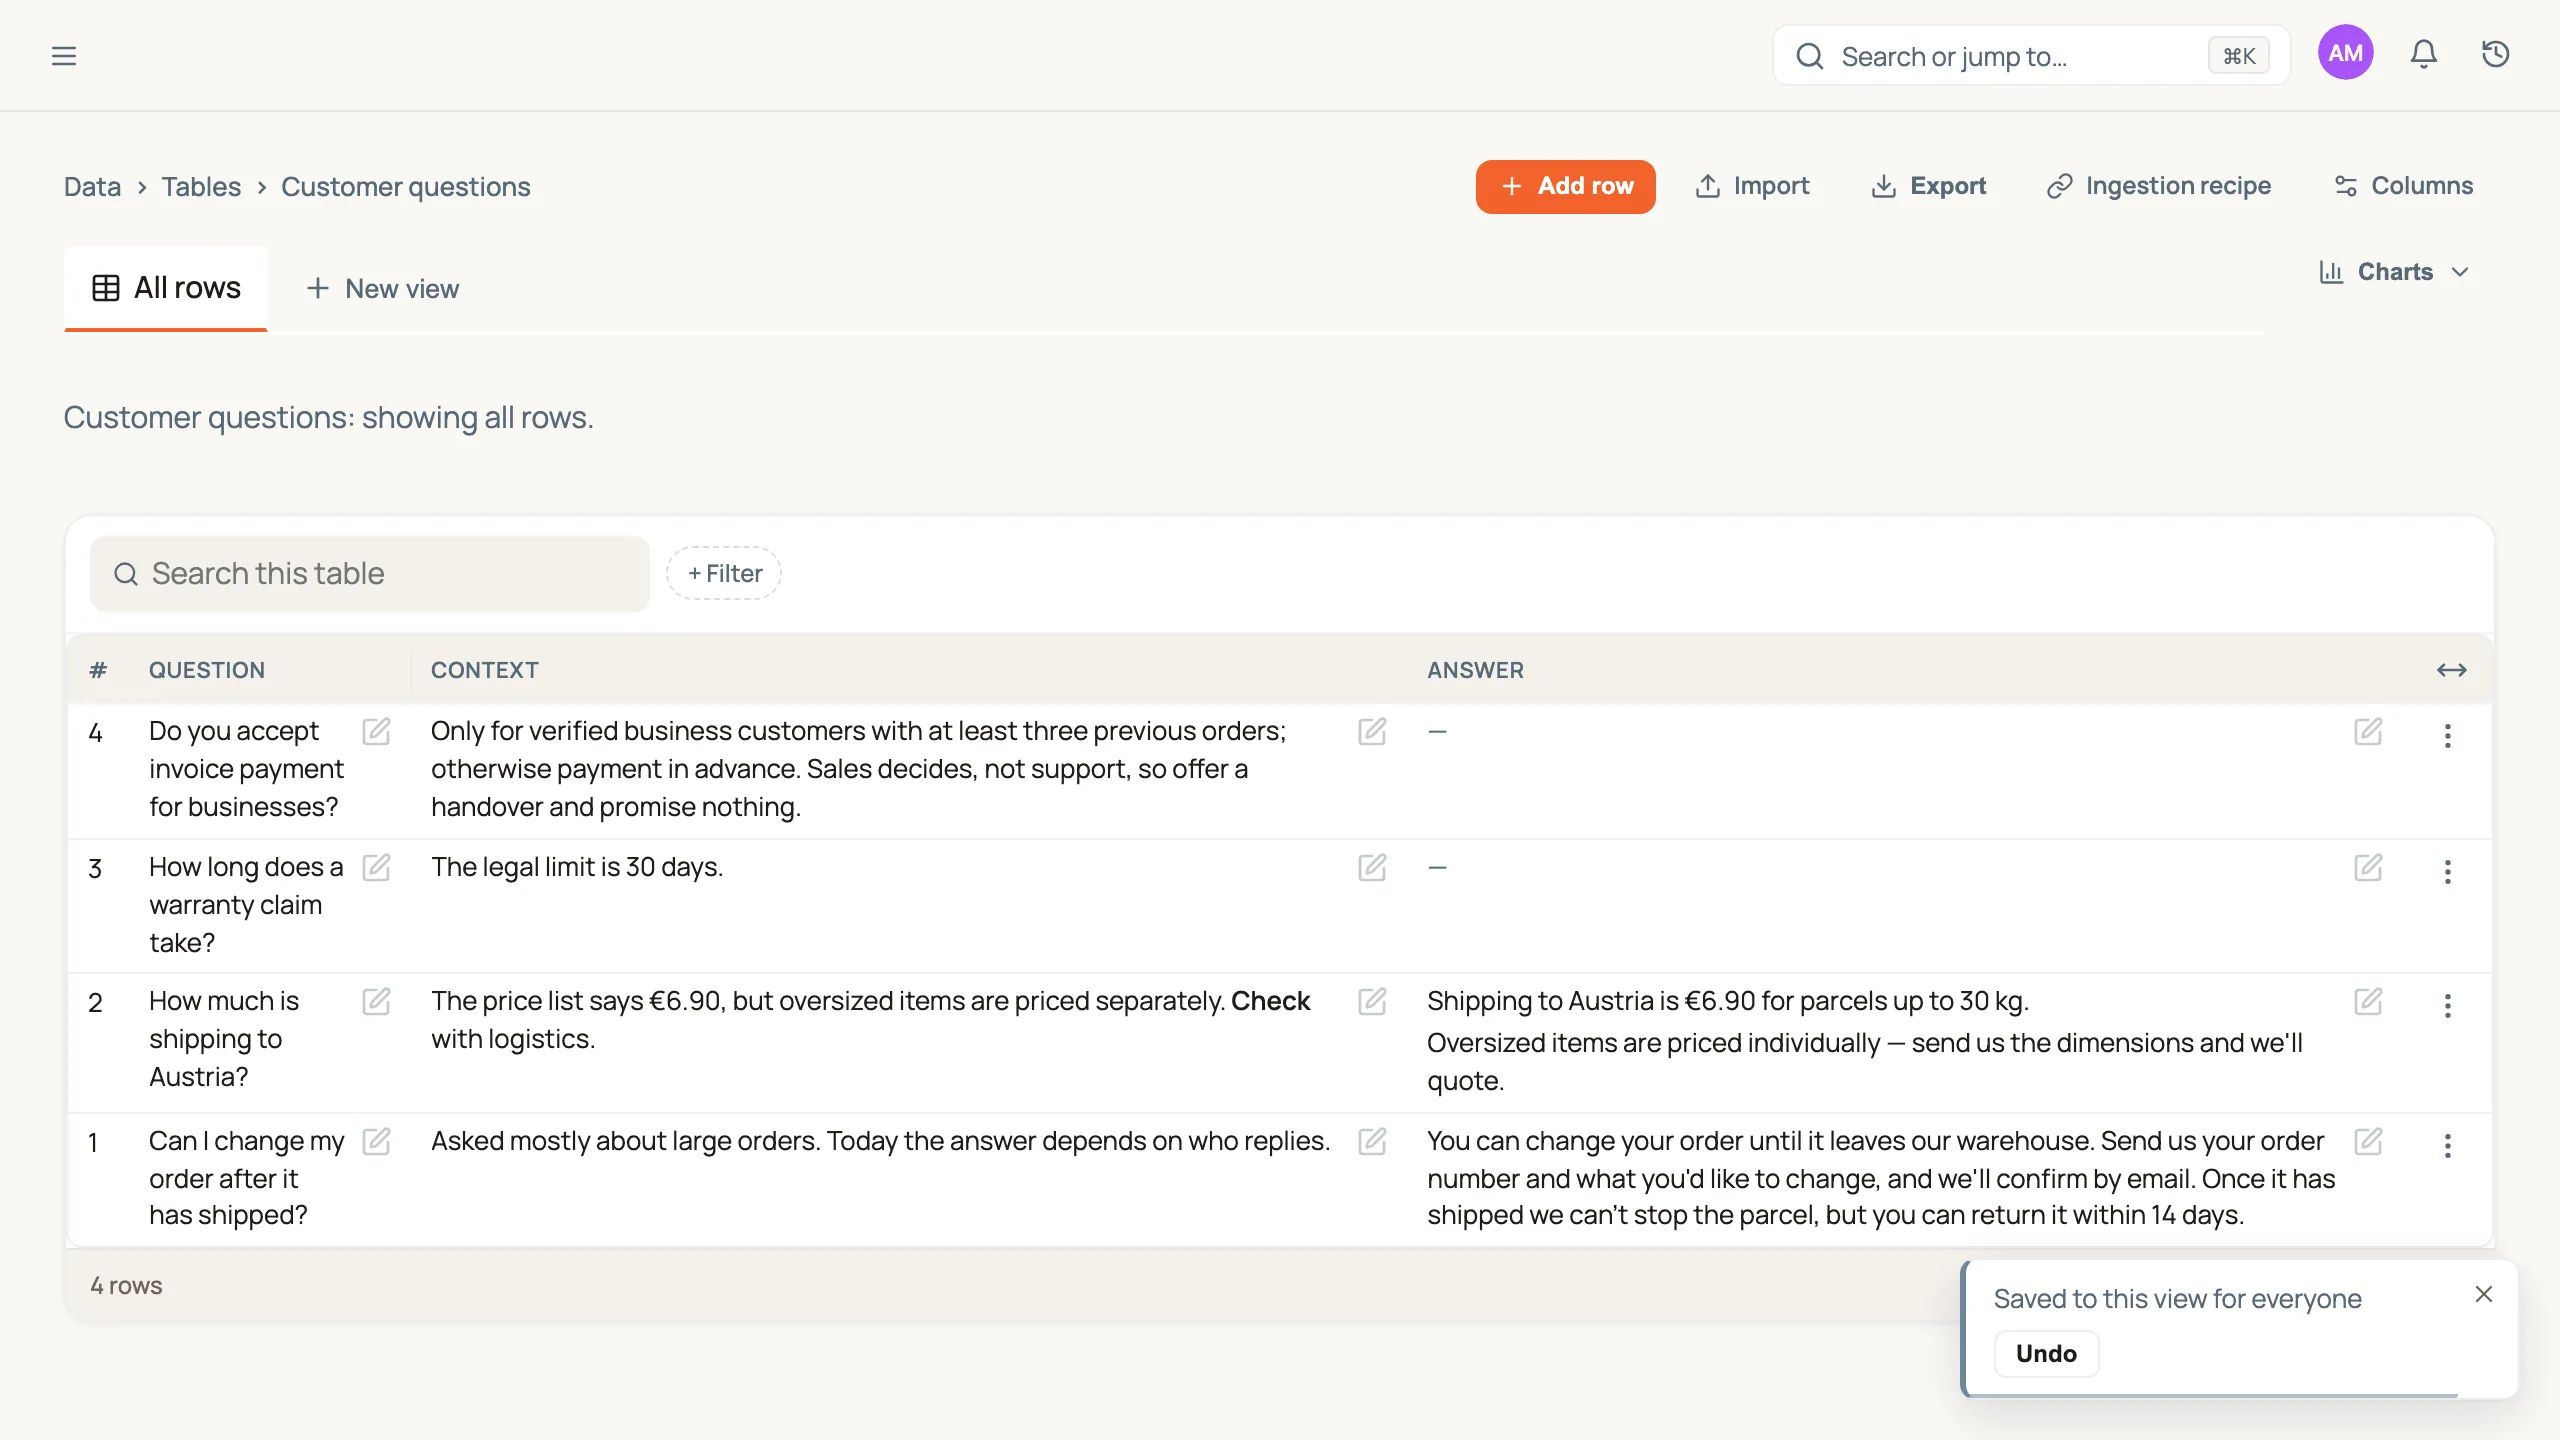
A layout belongs to the view, and everyone sees it. Widths and order are saved on the view you are looking at — All rows included — so a colleague who opens the same view sees it arranged the same way. That is why each change shows a short note, “Saved to this view for everyone”, with an Undo button: if you moved something by accident, one click puts it back for everyone.
Want an arrangement just for yourself, or for one job? Save a new view with New view and arrange that one; the original stays as it was. There are no per-person layouts, so a view never looks different depending on who opens it.
Putting a view on a dashboard
Section titled “Putting a view on a dashboard”A saved view can go on a dashboard as itself. With the view open, use Add to dashboard on the line that describes it, pick a board, and the view lands there as a compact grid: the same rows in the same order with the same columns and formatting, capped at 25 rows and saying so (“Showing 10 of 37”) when the view holds more.
The tile is a picture of the view and nothing more — it has no filters or sorting of its own, so changing what it shows means changing the view, once, in the place the grid reads from too. The grid and the board can never quietly disagree about what “cars by color” means.
The one thing you can change from the tile is a column that is yours to answer: a select with up to three options that no flow fills in, like a Yes/No verdict. The tile shows the same buttons as the table page, and a click stores the answer on the row; clicking the chosen answer again clears it.
If what you want on the board is the shape rather than the rows — bars, a line, one big number — that is a chart, which is a saved reading of the table in its own right.
The grid page refreshes itself when the underlying rows change — add, edit, or delete a row and the numbers update without a reload. A dashboard is server-rendered, so its tiles show the rows as of when you opened the board; reload it for the latest.
Worked example
Section titled “Worked example”A yard camera logs every vehicle it detects into a cars table — a plate column, a color select column, and a detected_at datetime column. You want a running answer to “how many of each color came through today, ignoring anything the camera couldn’t identify”:
- Open the
carstable and click + New view. - Add two filters:
Coloris notUnknown, andDetected atin the last24hours. - Set Group by to
Color, with no bucket (it’s a select column, not a date). - Add a Count metric.
- Name it
Cars by colorand save.
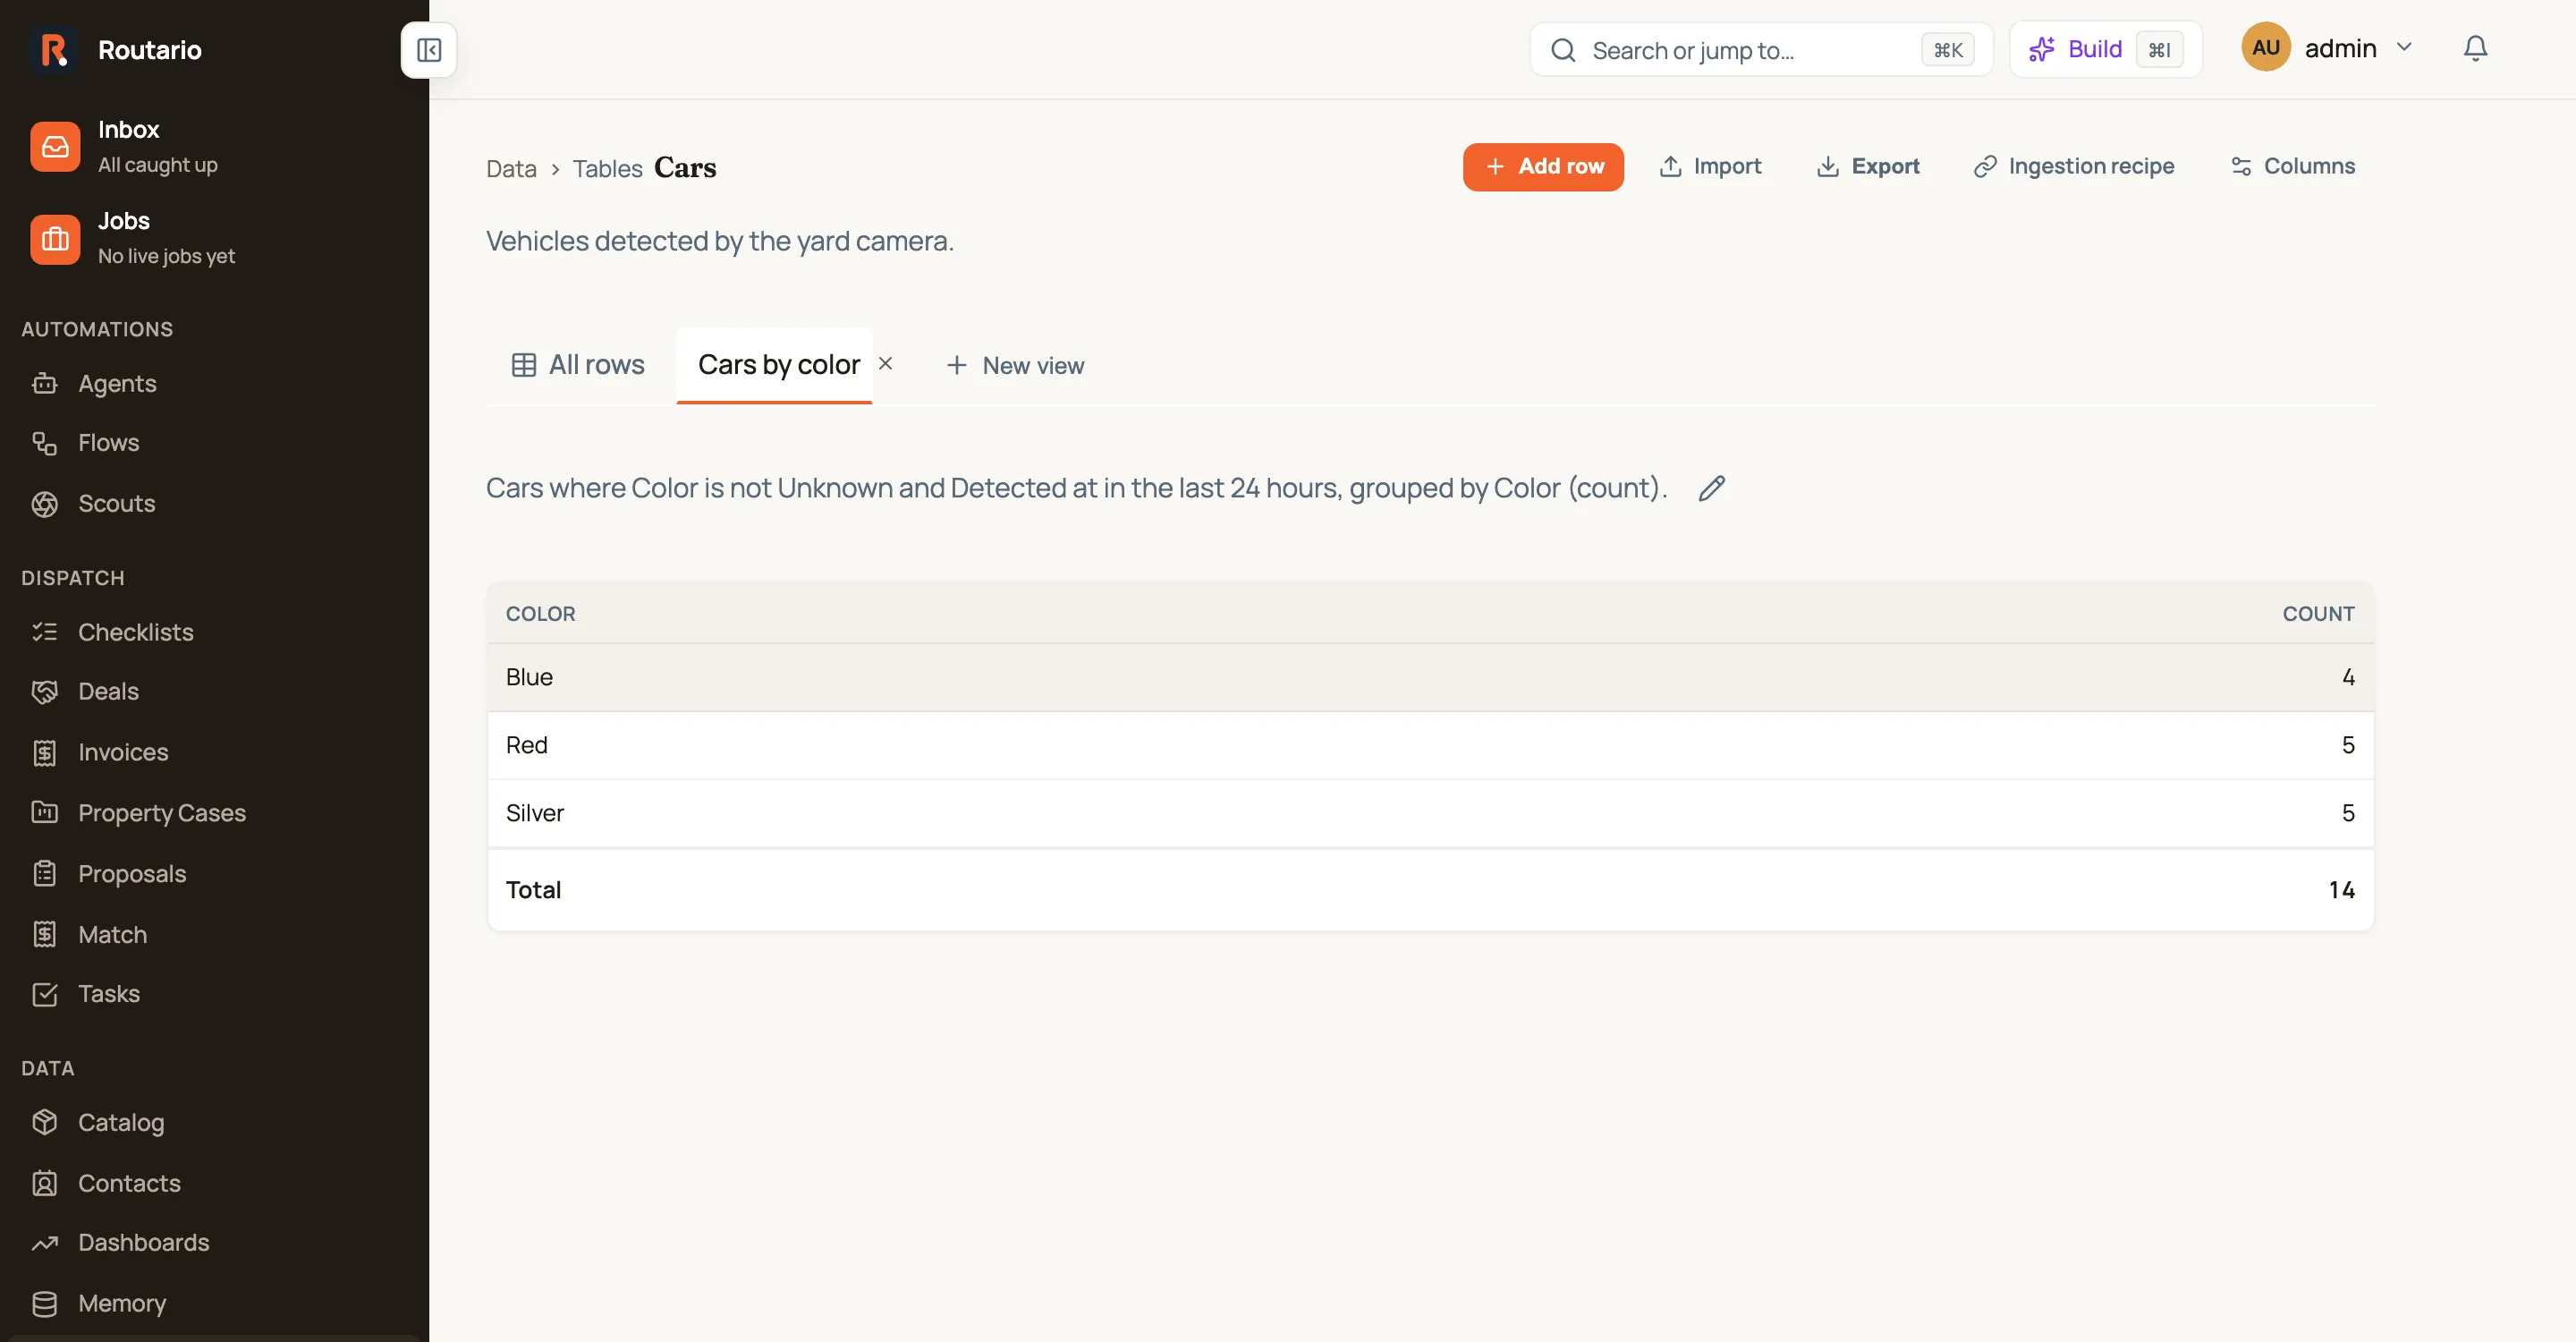
The result: a Cars by color tab next to All rows, showing one row per color with its count and a real total underneath — recomputed instantly as new detections land, and ready to put on a dashboard as-is.
What views don’t do
Section titled “What views don’t do”Views are deliberately a lightweight, single-table layer — not a query builder. They don’t do:
- Joins. A view only ever reads one table.
- OR logic or nested filter groups. Every filter you add to a view is combined with AND; there’s no “this OR that.” (The search box on the grid is the one OR — it looks in every text column at once. Save as view keeps it, but shows it as a plain line you can only keep or remove, because the filter builder has no way to take it apart.)
- Calculating a new column. A view groups and summarizes columns that already exist. If you need a percentage or a total that isn’t in the table yet, add a calculated column to the table first — then filter, group, and summarize it like any other column.
- Cross-table anything. No lookups into other tables, no rollups from a related table.
If what you need crosses one of these lines, that’s a job for a flow: pull from wherever the data lives, combine it however you need, and write the result into a table — which you can then filter, group, and summarize with a view like any other.
Where to go next
Section titled “Where to go next”- Working with data: tables and imports — creating tables and getting rows into them in the first place.
- Building an automation — when a view isn’t enough and you need a flow to combine, transform, or cross reference data first.
- Chart a table and build a dashboard — when the answer has a shape rather than a number, and how to put several on one page.
- Find records reference — reading rows from a table inside a flow, as distinct from a view.