

Running & debugging a flow
Every run moves through a small set of states from start to finish. Knowing them tells you what a flow is doing, what to look at when something goes wrong, and how to get useful output from a test run.
Run states
Section titled “Run states”| State | What it means |
|---|---|
| RUNNING | Steps are executing. |
| WAITING | The run is durably paused — on an Ask a person waiting for a human, or a Wait waiting for time or an event. It holds no thread and survives a restart. |
| COMPLETED | All steps finished successfully. |
| COMPLETED · with errors | The run reached the end, but a send step (email / notification / webhook) failed without halting it — check the step log for which send failed. Or it reached the end without doing anything the flow exists to do: none of its steps that send, write or hand work to an agent or another flow ran, and no Branch, Case or Loop chose to skip them. Its reason then starts with No outcome and names the step the run stopped after — usually a step with no connection onward. |
| FAILED | A step errored and the run couldn’t continue. The run detail shows the step and its error. |
| BLOCKED | A step couldn’t run at all — most often a required field resolved empty (the error names the exact {{ … }} reference; see Template variables for the usual cause). Also covers a sub-flow (called by a Run flow step) pausing on an Ask a person the parent didn’t pre-answer — resolve that by pre-answering it in the Run flow step’s inputs. |
| CANCELLED | Someone pressed Stop while the run was live — see Stopping a run for what that actually does. |
Run any flow by hand
Section titled “Run any flow by hand”Every flow has a Run button, whatever its trigger. You can run a cron,
webhook, or event flow manually any time — the run is recorded as a manual
trigger and the declared schedule is untouched. This is the normal way to test a
flow before turning its trigger on.
What a manually-run flow sees
Section titled “What a manually-run flow sees”A real webhook POST (or a Run API call) arrives with a JSON body, placed in the
run context under payload — so {{ payload.invoice_id }} gives you the field
your caller sent. See payload.* for the full
picture of where it comes from.
A manually-run webhook flow
Section titled “A manually-run webhook flow”When you run a Webhook-triggered flow by hand, there’s no POST body, so
{{ payload }} is an empty value. Any step that reads {{ payload.something }}
gets nothing.
Cron and event flows have no inbound payload either — their context starts with
just the system namespaces (user, now, workspace).
A Manual-triggered flow that expects a payload
Section titled “A Manual-triggered flow that expects a payload”Some flows have no real external trigger at all — their canvas trigger is
Manual, and they’re meant to be started entirely from the outside via the
Run API, e.g. a scheduled job elsewhere in your stack posting a
weekly report. Pressing Run on a flow like that normally sends no payload
either, which makes its {{ payload.x }} references awkward to develop and test.
The Manual trigger’s panel has a Test payload field for exactly this:
a toggle — “Send a test payload when I click Run” — plus a JSON box. Turn it
on, paste the shape your real caller will send, and every press of Run
injects it as payload, so {{ payload.x }} resolves and you can watch the
flow run end to end before anything external ever calls it.
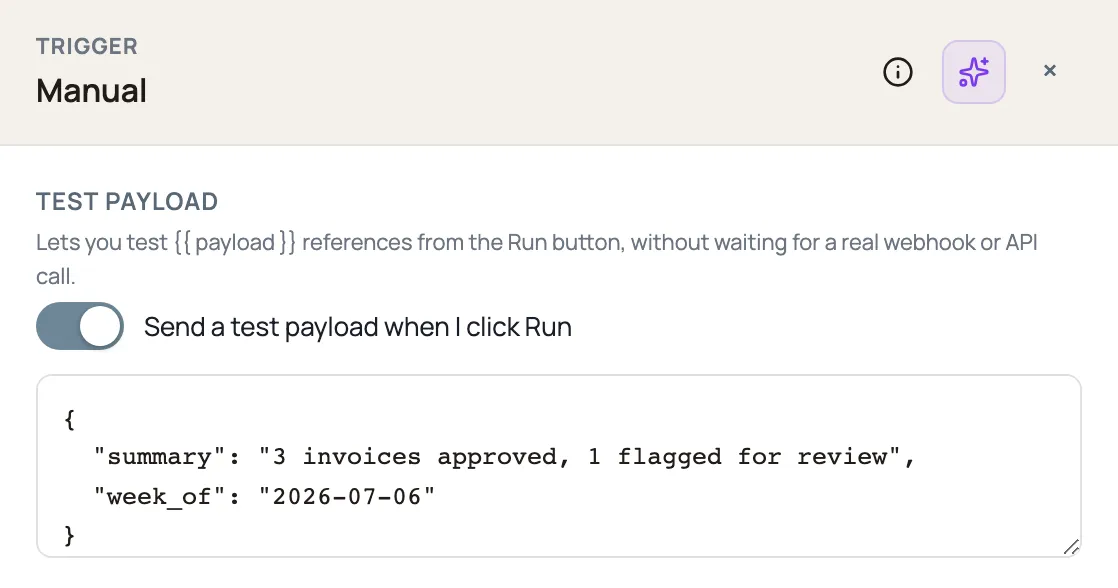
The JSON box validates as you type — leave it in an invalid state and an inline error explains why, without saving; a valid save takes effect the next time you press Run.
Watching a live run
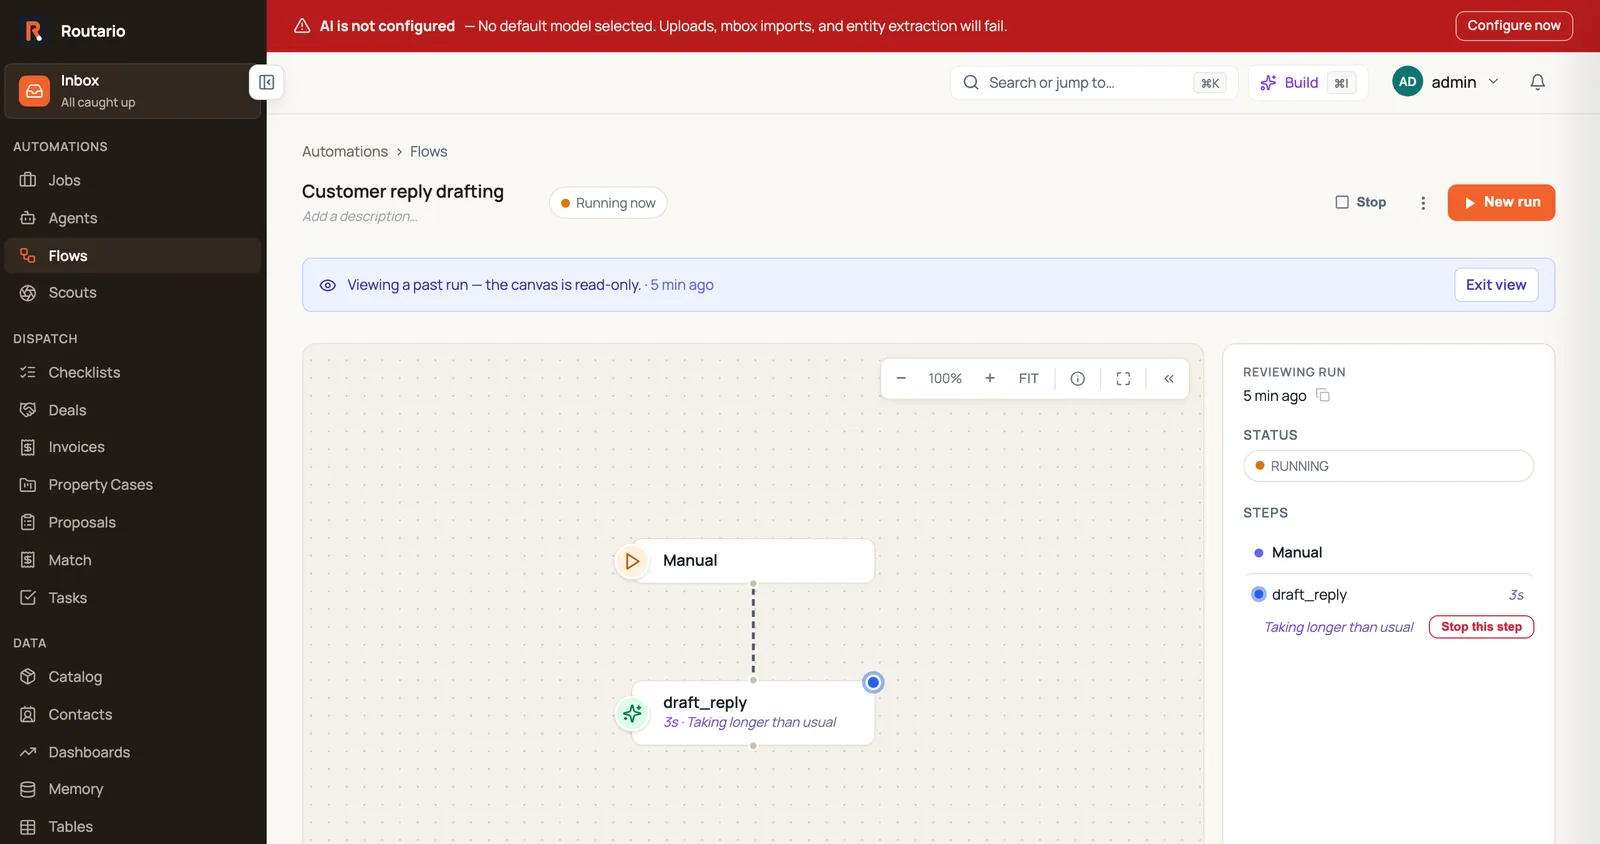
Section titled “Watching a live run”While a step is RUNNING, its node shows an elapsed timer next to a short
phrase describing what’s happening — e.g. 12s · Calling
claude-3.5-sonnet. The same two pieces of information repeat in the side
panel when you open the run in review mode. The timer is always real — it
keeps counting even if the phrase itself stops changing, so a frozen number
(not a frozen phrase) is the honest sign something actually stalled, not a
dead page.
For most step kinds the phrase is a light rotating placeholder (“still
going…”, “working on it…”) — there’s no real progress to report, so it
doesn’t pretend to have any. For an Ask AI,
Classify, Extract,
Summarize, Speech to Text, or
Text to Speech step, the phrase is a real signal
from the call itself: “Calling <model>”, then “Receiving · N tok” while the
answer streams in.
Nothing shows for the first couple of seconds of any step — one that finishes quickly never flashes anything at all.
When an AI step is taking a while
Section titled “When an AI step is taking a while”For those same six AI steps, Routario keeps a running history of how long that exact model normally takes, recorded automatically from every real call your instance makes. It uses that history to tell you, honestly, whether the current wait is normal or not — never a fixed number that’s wrong for a slow model and alarmist for a fast one:
- Within the model’s usual range — nothing changes; the plain “Calling
<model>” phrase is enough. - A bit past normal — the phrase gains a quiet acknowledgment: “Calling
<model>— still going…”. - Well past normal — the phrase changes to “Taking longer than usual”, and a real Stop this step button appears next to it in the side panel. This is the point where it’s worth acting rather than just watching.
- Close to timing out — the phrase becomes “Will time out in ~Ns if nothing comes back” — the step’s own configured timeout, not a guess.
A model that’s new to your instance (fewer than around 10 logged calls) has no history yet, so Routario starts from a flat, deliberately-conservative estimate and switches to the model’s real numbers automatically once enough calls have gone through it.
Stopping a run
Section titled “Stopping a run”Pressing Stop — on the canvas header, or the Stop this step button described above — asks Routario to halt the run as soon as it safely can, not instantly. A run that’s mid-step inside a single call (an LLM request, a module doing its work) can’t be interrupted during that call; Routario waits for it to return, then stops before the next step starts. You’re told exactly what to expect, not a vague “stopping…”:
- If the current step has a known timeout, you get the real number — e.g. “Stopping — will halt once the current call finishes; it’s set to time out after ~120s (a fallback attempt, if any, restarts that clock).”
- If it doesn’t (most non-AI steps), you’re told plainly that there’s no estimate, rather than a made-up one.
The run stays RUNNING until Routario actually reaches that safe point, then
flips to CANCELLED.
Reading the step log
Section titled “Reading the step log”Every run has a step-by-step history. Each entry shows the step’s status, its
resolved inputs (what each field actually became after templates were
substituted — the first place to look when output is wrong), its output, and,
for failures, the error. An {{ invoice.amount }} that resolved to empty
means invoice wasn’t in context yet — the upstream step that should have
produced it didn’t run, or didn’t write that key.
A debugging loop
Section titled “A debugging loop”- Press Run on the canvas — you don’t need a real trigger to fire.
- Watch it complete or fail (a pulsing node is currently executing).
- Open the run to enter review mode; click any node to inspect it.
- Read the resolved inputs to see exactly what each field became.
- Fix and re-run. Exit view, adjust, Run again — each run is independent, so you can compare outputs across attempts.
- See an automation’s run history — every run this flow has had, filterable and exportable.