

Chart a table and build a dashboard
A saved view answers “what are the numbers?” A chart answers “what shape are they?” — and some questions only have a shape for an answer. Whether ticket volume is climbing, whether the mix of outcomes is shifting, where people drop out of a process: you can read all of that from a picture in a second, and from a table of numbers only with effort.
This guide covers building a chart on a Custom Table, the thirteen shapes on offer (including the pie, the funnel, the timeline, the overlap count and the range — five that answer questions none of the others can — and horizontal bars for a long ranking), charting Routario itself (including your sales pipeline), what a chart does when there is simply no data, and composing charts, saved views, and written notes into a dashboard.
What a chart is
Section titled “What a chart is”A chart is a saved reading of one table, stored as configuration and recomputed every time someone looks at it. Nothing is copied or cached — open the chart tomorrow and it reflects the rows as they are tomorrow.
Two pieces make one up:
- What runs along the bottom — a column to group by, or the record’s own creation date bucketed into hours, days, weeks, or months.
- One or more series — each a filtered measurement sharing that same bottom axis. “Tickets seen” and “tickets we posted a reply to” are two series over the same days.
That second part is the whole reason a chart is not just a view drawn as a picture. A view groups your rows one way and counts them. A chart can put several differently-filtered measurements side by side on one axis — seen vs attempted vs posted — which is what makes a comparison, a stacked breakdown, or a funnel possible at all.
Charts live behind the Charts button at the top right of the table, to the right of your saved-view tabs. Open it and you get every chart on that table in one list: the picture charts first, then any Numbers — the one-figure kind — each showing its current value right there, so the answer to “what is the average wait?” needs no clicking through. + New chart is the last item.
Saved views stay as tabs and charts do not, because a table tends to accumulate many more charts than views and chart names run long — nine of them will not fit across a screen, whereas a list has room for all of them at full length. When you are looking at one chart, the button names it, so it doubles as a way back to the others. And if a dashboard already shows charts from this table, the menu links it near the bottom: that board is where you see them all side by side.
You can also start from Data → Dashboards, where New chart asks “What should the chart read?” and lists everything you could chart in two groups: The platform itself and Your tables. That is the better door when you are building a board rather than exploring one table.
Building a chart
Section titled “Building a chart”The editor is the chart itself, large, with a settings pane beside it. Every change redraws the chart immediately, so you are never guessing what Save will produce.
Name it on the chart. The name and the optional subtitle are typed straight onto the chart’s heading — the subtitle is a sentence explaining what the reader is looking at, and is worth writing.
The pane, one area at a time. Along the top of the pane is a row of icons — Shape, Data, Series, Axes, Labels, Lines — and the pane shows one of them at a time. An area the chosen shape cannot use is not offered at all: a funnel has no Axes and no Lines. A dot on an icon means something in that area is set differently from how a new chart starts. When you come back to edit another chart, the pane opens on the area you used last.
Every setting says what it is set to. Inside an area each setting is one row: its name, and underneath, its current value in words — Goal at 20 · above the line is good, Received, one slot per day, Off. You can read a whole chart’s settings without opening anything. Change opens the controls for that one setting, with the explanation of what it does right beside them. A switch on the left turns a setting on or off where that is a real choice — values on the marks, the legend, targets; a faded switch marks something every chart of this shape always has, like its value axis.
Click the chart to change it. Click any part of the drawn chart and the pane opens the setting behind it: a bar, a point or a legend entry opens its series; a target line opens Targets; the labels along an axis open that axis.
Shape. Pick from the gallery of thirteen shapes; the sentence under it says what the selected one is for.
Along the bottom. Pick the column whose values become the slots on the x axis, or Created at to use the record’s own timestamp. When the column is a date, a Grouped by control appears: Day, Week, Month, Hour, or the cyclic buckets Day of week, Hour of day, Month of year. The two families answer different questions, exactly as they do in views — a sequential bucket plots a timeline, a cyclic one collapses the timeline into a repeating cycle. See Filter, group, and summarize a table for the difference.
Leave out rows with nothing in this column. Rows that never filled the x column still group — into one slot labelled — at the end of the axis. On a category axis that is often the finding (“twelve tickets have no topic”), so it is shown by default. On a date axis it is a thing that is not a day, sitting after the last day, and it quietly costs you one: with Show at most set to 21, the — takes one of the twenty-one and the oldest real day falls off. Tick this box to leave those rows out of the chart entirely — not just hide the slot, so every average and total is computed without them too.
The condition is asked of the group, not the cell, which is what makes it match the — you can see. A blank string counts as nothing, the same way an unfilled cell does. And once a date is bucketed, a value the calendar cannot read — a half-typed date, an imported string that is not one — has no day to belong to, so it goes with the rest. Grouped raw, with no bucket, that same value is something somebody typed and keeps its own slot.
Only include rows where. This filter sits above the series list and narrows the whole chart — every series at once — which is different from a series filter narrowing just one measurement (below). It is the right place for a condition that should apply everywhere, such as “the last 7 days” or “region is EMEA”, instead of repeating it on every series. Leave it blank to chart every row.
A few comparisons need more than one value at a time — matching any of several options, matching none of them, a date range — and one text box cannot hold that. A filter built that way from outside the editor shows here as read-only text instead, and saving the chart leaves it exactly as it was.
Series. Each series is a card: its colour, its name, and one sentence saying what it counts — Count of rows where Outcome is sent_as_is. Change opens its name, its measurement, an optional filter (where … — leave it blank for “all rows”), its colour and a description that readers see when they hover it. The measurement defaults to counting rows; you can also sum, average, or take the minimum, maximum, or distinct count of a number column. Add as many series as the question needs, remove one with the bin on its card, and drag the handle to reorder them — the order is what you see in the legend, and for a funnel it is the content itself.
Saving. The bar at the bottom says when you have unsaved changes, and Cancel then reads Discard changes. Save with the button or with Cmd/Ctrl+S. Before anything is saved, the chart is checked: if something would stop it saving — a series pointing at a column that is gone, a missing name — the bar says what, and everything you changed stays on the page for you to fix. Leaving the page with unsaved changes asks first.
Colours: two vocabularies, on purpose
Section titled “Colours: two vocabularies, on purpose”The Colour picker offers numbered swatches and four named ones — success, warning, error, neutral. The difference matters more than it looks.
A number names a colour and claims nothing about the data. Painting Room 1 green is a rendering choice, not a statement that Room 1 is doing well.
A name makes a claim your reader will believe. Calling a series success says it went well, and it takes the same green every badge and alert in Routario uses. That is exactly right for “sent as-is” vs “discarded”, and exactly wrong for “Room 1” vs “Room 2”.
So: reach for a number when you just want a particular colour, and a name only when the name is true. The palette holds twelve colours and cycles — a thirteenth series takes the first colour again, which is fine, because past a dozen series nobody is reading a chart by colour anyway.
Presentation
Section titled “Presentation”The Axes, Labels and Lines areas decide how the numbers read rather than what they measure:
- Show numbers as — left on automatic, a duration measurement renders as time (
2 d 5 h) and everything else as a plain number. Force it instead: plain, thousands (1.2k), currency (with your symbol), percent (the value is already 0–100), ratio (the value is a 0–1 fraction —0.44renders as44%), or duration (2 d 5 h). - Show dates as — leave it on automatic (which drops the year when every slot repeats it) or force a format: full date, short, day and month, weekday, month and year, time, or the raw stored value.
- Value axis title, Start the value axis at zero, and a Value range if you want to pin the axis minimum and maximum yourself, the way you would in a spreadsheet.
- Stepped line — hold each value until the next slot, which is the honest shape for something that changes on a day rather than drifting between two.
- Order the axis by and Show at most — order slots by label or by value — the slot’s total, or one series you pick — and keep only the top or most recent few.
- Tilt the labels along the bottom and Label every — two ways out of a crowded bottom axis. See below.
- Draw a line between the slots — a faint line at each boundary along the bottom, on bars and ranges. See below.
When the labels along the bottom get crowded
Section titled “When the labels along the bottom get crowded”Long labels collide. By default the chart works out how many fit and draws every second or third one rather than letting them overlap into a smear — so a chart with labels like 08-13#2 on a half-width tile will quietly show about half of them.
Two controls override that:
- Tilt the labels along the bottom. Turned 45°, a label needs about a third less width, so far more of them fit. It costs a little height below the chart. Reach for this first — on a fourteen-slot chart with labels that long, tilting alone usually brings every one back.
- Label every N. The explicit answer: draw every 2nd, 3rd, 5th label. Leave it empty to let the chart decide. Setting it to 1 means every label, however crowded — if you would rather have overlap than gaps, you can say so.
They combine. Tilt first, and only reach for a number if you still disagree with the result.
When there are simply too many categories for one bottom axis — forty sites, a hundred products — no amount of tilting helps. Switch the shape to Bars, horizontal: the categories run down the left, each on its own row, and each bar’s value is printed at its end. Bars, horizontal, stacked does the same for parts of one whole — answers per brand split into recommended and not — with each part’s number inside it where it fits and the total at the bar’s end. A name too long for the left-hand column is cut with an ellipsis; hover it for the whole name. On a category axis it ranks the bars largest first unless you choose another order, so Show at most 10 gives you a top ten. On a dashboard a long list scrolls inside its tile instead of shrinking every row.
A third control helps once the labels fit but the marks still blur together: Draw a line between the slots. It puts a faint line — the same weight as the horizontal gridlines — at each boundary between two slots, so with twenty-odd products side by side every bar or dot reads against its own label rather than its neighbour’s. A tilted label hangs from the middle of its slot, so without the lines the eye has only the gaps to go on. It is offered on upright bars (side by side and stacked) and on the range, where it is on by default; untick it to take the lines away.
The thirteen shapes
Section titled “The thirteen shapes”Each shape answers a different question, so pick by the question. The editor says what the selected shape is for right under the Shape picker, and Board tiles has a page for every shape: when to use it, when not to, and what the table needs for it to work. The editor, that reference and the AI drafter all read the same description, so they cannot disagree.
Every stacked shape — bars upright or horizontal, and areas — has a Show as switch: Amounts, or Share of each bar (100%). Absolute stacking cannot answer “what was the mix”, because a day with 4 tickets and a day with 400 look nothing alike. Show each bar as its own 100% and they become directly comparable — which is usually the question when you are looking at a breakdown of outcomes. The numbers then read as percentages, and hovering a part still shows the count behind it (“80% (4 of 5)”). A pie asks the same “what’s the mix” question with the slots removed entirely — one breakdown of the whole table (or everything your filters match), not one per day. Reach for a stack shown as share when the mix is something you want to compare across categories or watch change; reach for a pie when there is only one mix and you want to see it at a glance.
(The separate “Bars, 100% stacked” and “Area, 100% stacked” shapes are gone: a chart saved with either now opens as the stack with Show as set to share, and draws exactly as before.)
To rank by one part rather than by the whole bar, set Order the axis by to Value and pick the series beside it. On visa’s “Recommendations by brand”: Bars, horizontal, stacked · Show as: Share of each bar · Order by: Value of Recommended, descending — the brands most often recommended first, as a percentage.
One number takes exactly one series and has no axis at all. It is the same machinery as every other chart — same filters, same measurements — and the only difference is that the answer is one figure instead of a row of them.
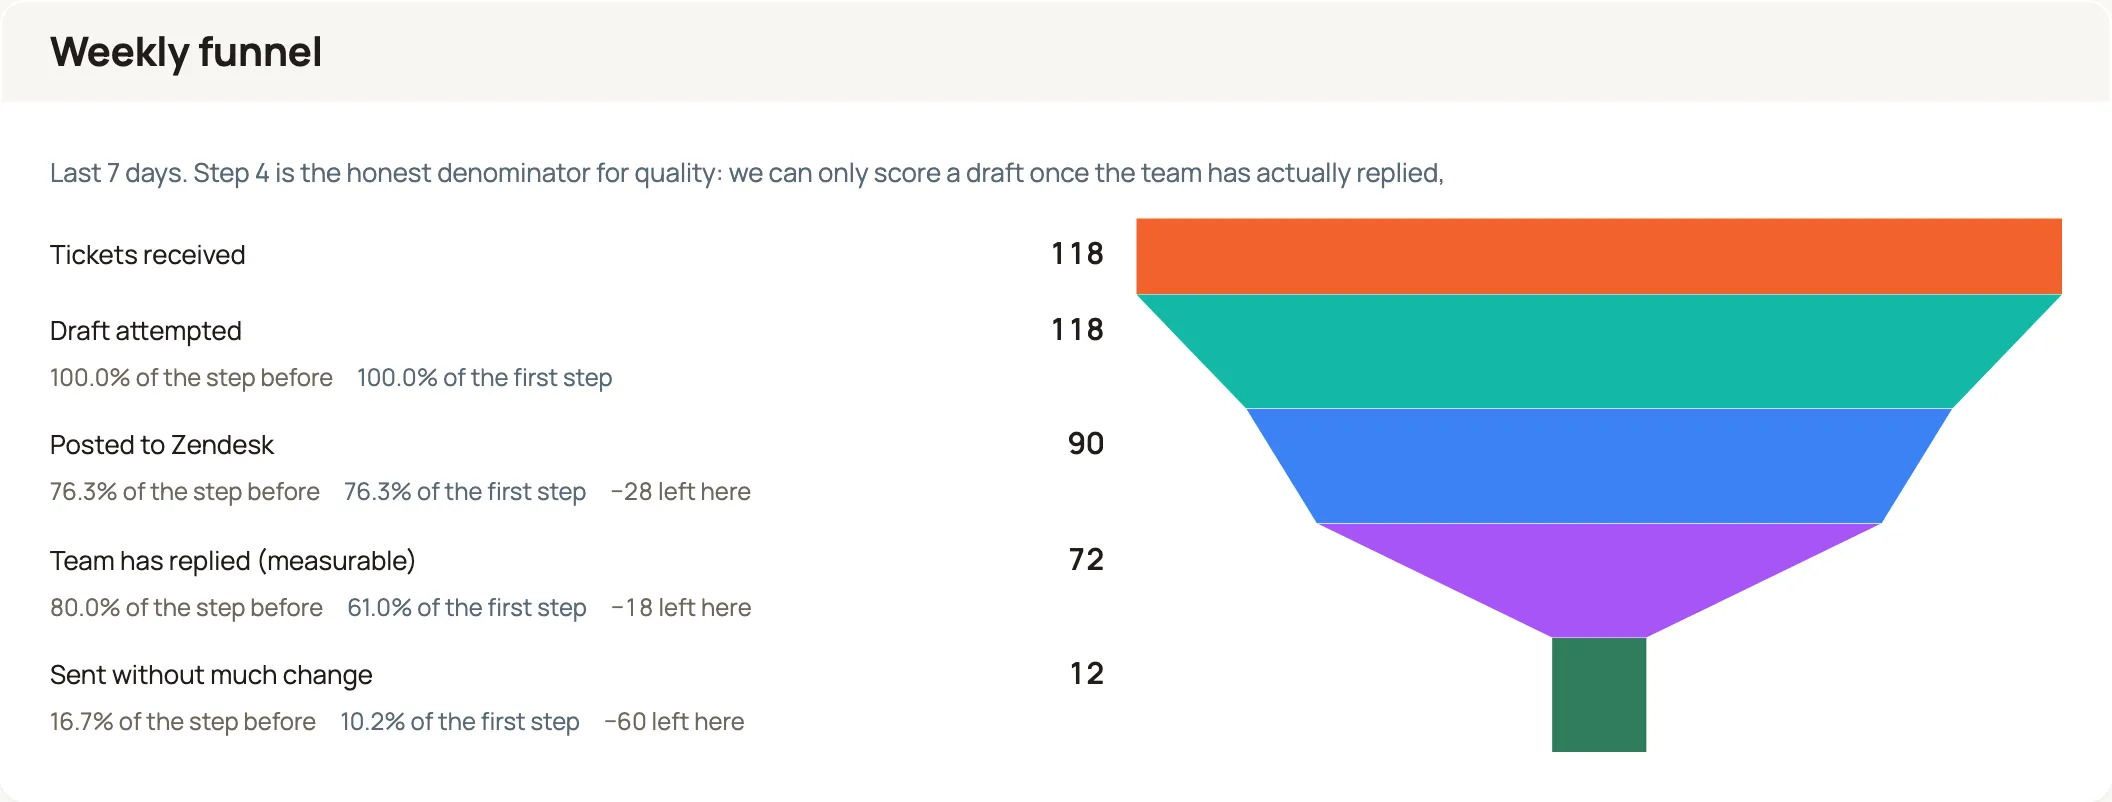
The funnel
Section titled “The funnel”A funnel answers a question none of the other shapes can: of everyone who started, where did they stop?
Its steps are not categories side by side. They are nested: everyone at step 3 was already at step 2, and everyone at step 2 was already at step 1. That is the whole claim, and it is why a funnel is drawn as a single narrowing shape rather than as a set of bars. Bars sitting next to each other say “five separate things, largest first” — a ranking. A funnel says “one population, thinning as it goes.”
A funnel has no axis along the bottom. Its series are Steps, and their order is the content — Routario never re-sorts them, however the numbers come out. If step 4 is bigger than step 3, that is drawn faithfully, because in a funnel it means something is wrong with the data or the definition, and hiding it by sorting would be the worst possible response.
Each step reports three things:
- Its count.
- Of the step before — where this stage is leaking. This is the number that tells you which stage to go and fix.
- Of the first step — the compounded rate, what the whole sequence yields end to end.
Both matter and neither substitutes for the other. Take 100 → 10 → 1: step 2 keeps 10% of step 1, step 3 keeps 10% of step 2, and the whole funnel yields 1%. A funnel showing only the step-to-step rate makes you multiply in your head; one showing only the compounded rate hides which stage is actually responsible. Routario shows both, plus how many were lost at each step in absolute terms — because “76% got through” and “28 left here” are the same arithmetic and not the same sentence, and only the second one names something you can go and do about it.
A worked example
Section titled “A worked example”A support team wants to know where drafted replies stop being useful. Every ticket writes a row to a support_answer_log table. The funnel is five series, all counting rows, each with a tighter filter than the last:
| Step | Filter | Result |
|---|---|---|
| Tickets received | (all rows) | 167 |
| Draft attempted | Attempted is 100 | 83 |
| Posted to the helpdesk | Posted is 100 | 59 |
| Team has replied | Approved is not empty | 11 |
| Sent without much change | Approved is 100 | 3 |
Read it and the story is immediate: drafting covers half of what arrives, three in four drafts get posted — and then it falls off a cliff, because you can only score a draft once a human has actually replied, and that lags by days. Step 4 is the honest denominator for quality, not step 1. That is a thing you would never notice in a table of five numbers and cannot miss in the shape.
The pie
Section titled “The pie”A pie answers a simpler question than a funnel does: of everything you’re measuring, what share does each thing make up?
It shares the funnel’s shape in one respect — it has no axis along the bottom either, and its series are the content directly: each one becomes a wedge, named by its series label. What it drops is the funnel’s order and nesting. A pie’s series are not steps someone passed through one after another; they are independent counts sitting side by side, which is exactly what a slot in a 100% stacked bar already is — a pie is that same idea with the slots taken away, because there is only one mix to show.
A slice’s share is worked out from the slices on the chart, not from a total pulled from anywhere else. Three series reading 44, 46, and 28 draw as 37.3%, 39.0%, and 23.7% — each one’s share of 118, the sum of exactly those three numbers. Add a fourth series and every percentage moves, because the whole they are shares of just got bigger. This is different from, say, ”% of all tickets ever logged” unless every series between them already adds up to that.
A slice whose filter matches nothing draws no wedge — a true zero contributes nothing to the whole, which is the correct answer. This is also the one place a pie doesn’t follow the zero-and-nothing rule below: an average with no matching rows is ordinarily drawn as a gap, because “the average of nothing” genuinely has no value. A pie slice can’t do that — there is no such thing as a wedge of undefined size — so a slice with no answer to average draws as a zero-width sliver instead of breaking the chart.
A worked example
Section titled “A worked example”The same support_answer_log table from the funnel example, read a different way. Instead of where does a draft stop being useful, the question is simply how do tickets end up: three series, each counting rows with one outcome.
| Series | Filter | Count |
|---|---|---|
| Sent as-is | Outcome is sent_as_is | 44 |
| Rewritten | Outcome is rewritten | 46 |
| Discarded | Outcome is discarded | 28 |
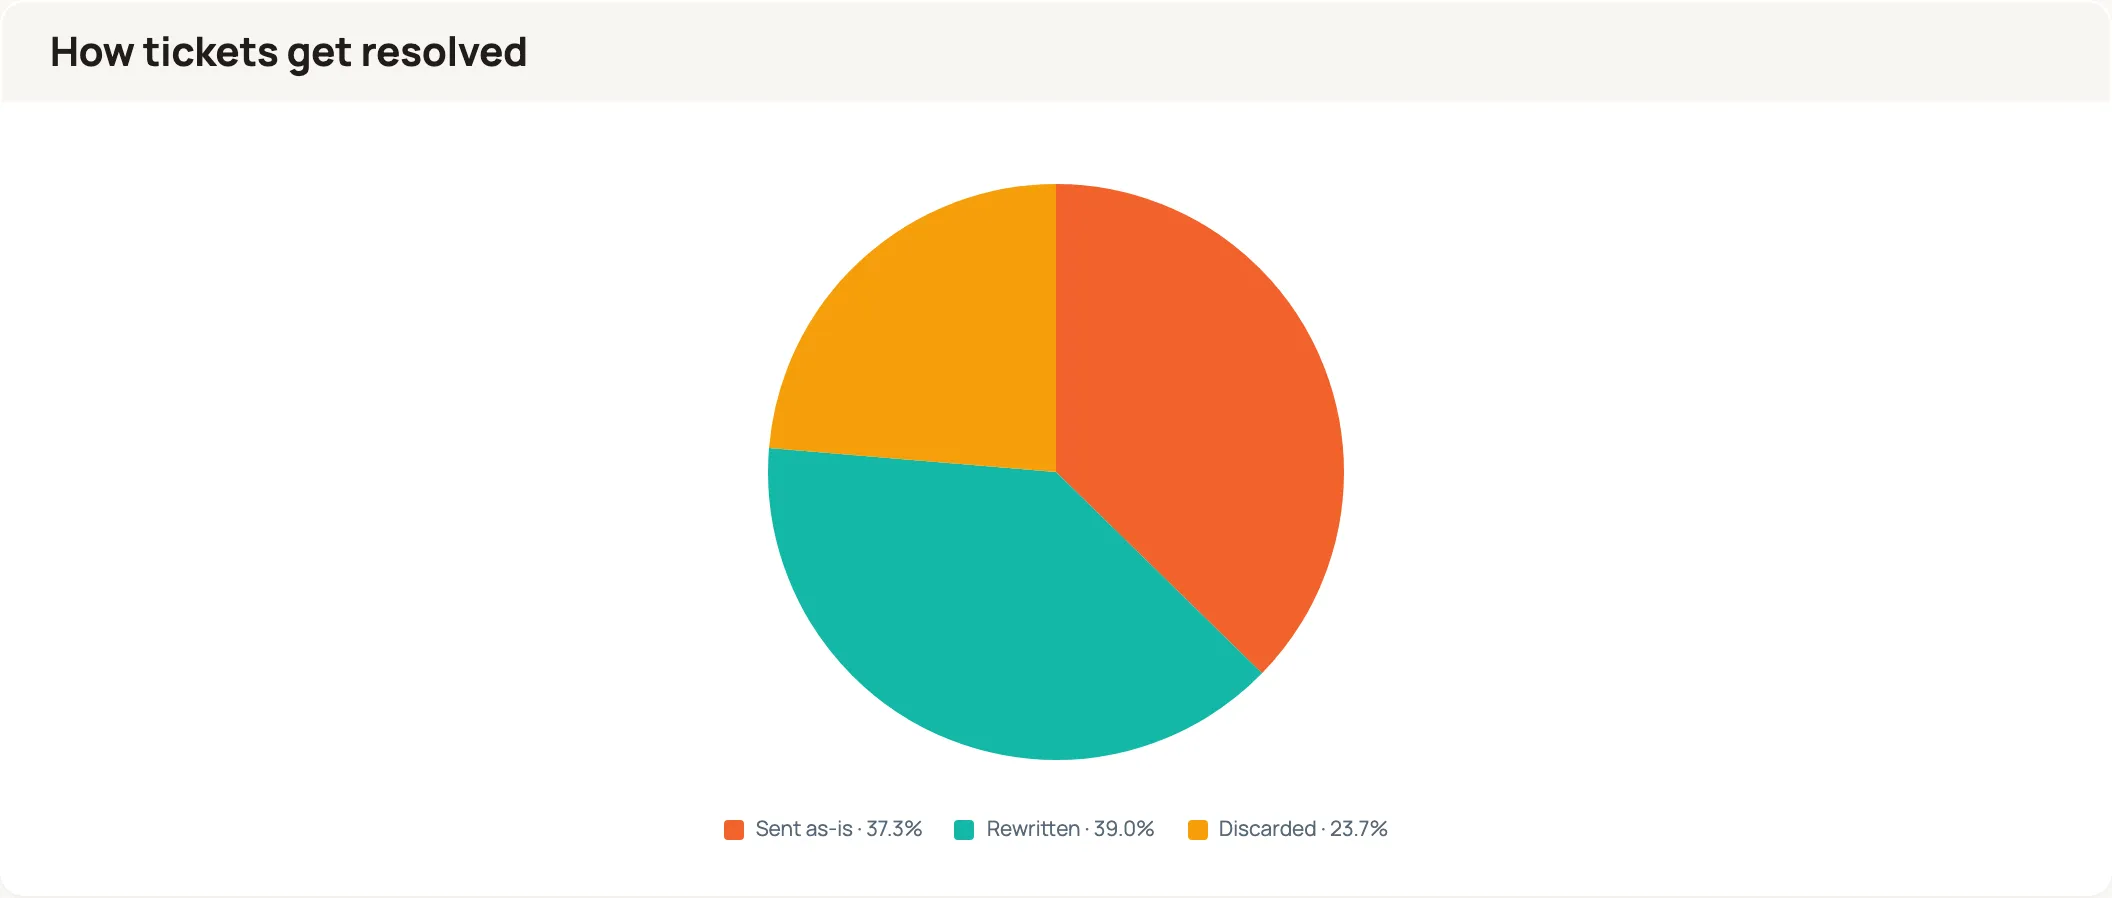
Where the funnel told you which stage to go and fix, the pie tells you what the split looks like right now — the two questions a support lead actually asks in the same meeting, off the same table.
When things happened, and how many at once
Section titled “When things happened, and how many at once”Every shape above aggregates: it answers “how many” or “how long on average”. Two shapes deliberately do not, because averaging destroys the thing you are asking about — the gaps between your rows.
Both read a start column and an end column instead of a single measurement. Where the other shapes ask you to pick an aggregate, these two just ask which two moments to read, because the shape has already decided the rest.
Timeline — when each thing happened
Section titled “Timeline — when each thing happened”A timeline draws one row per record, placed where it actually happened on a clock. Rows band by day, and every band shares one clock, so a quiet Tuesday and a heaving Thursday sit on the same scale and can be compared by eye.
Give it two series and each row nests them — waiting, then working.
A worked example: a haulage yard
Section titled “A worked example: a haulage yard”A haulage yard records four moments per delivery: when a truck arrived, when it reached the bay, when it left the bay, and when it left the site. One day looked like this:
| Truck | Arrived | On the bay |
|---|---|---|
| 1 | 11:59 | 11:59 → 13:16 |
| 2 | 12:49 | 13:16 → 14:57 |
| 3 | 14:01 | 14:57 → 15:57 |
A bar chart of “minutes waited” tells you truck 2 waited 27 minutes. It cannot tell you why. The timeline can, in one glance: truck 2’s waiting bar ends exactly where truck 1’s bay time ends, and truck 3 starts the moment truck 2 leaves. There is one bay, and the queue is the shape.
Set it up with the row label (Truck) along the bottom, and two series:
- Waiting — from
ArrivedtoAt bay - On the bay — from
At baytoLeft bay
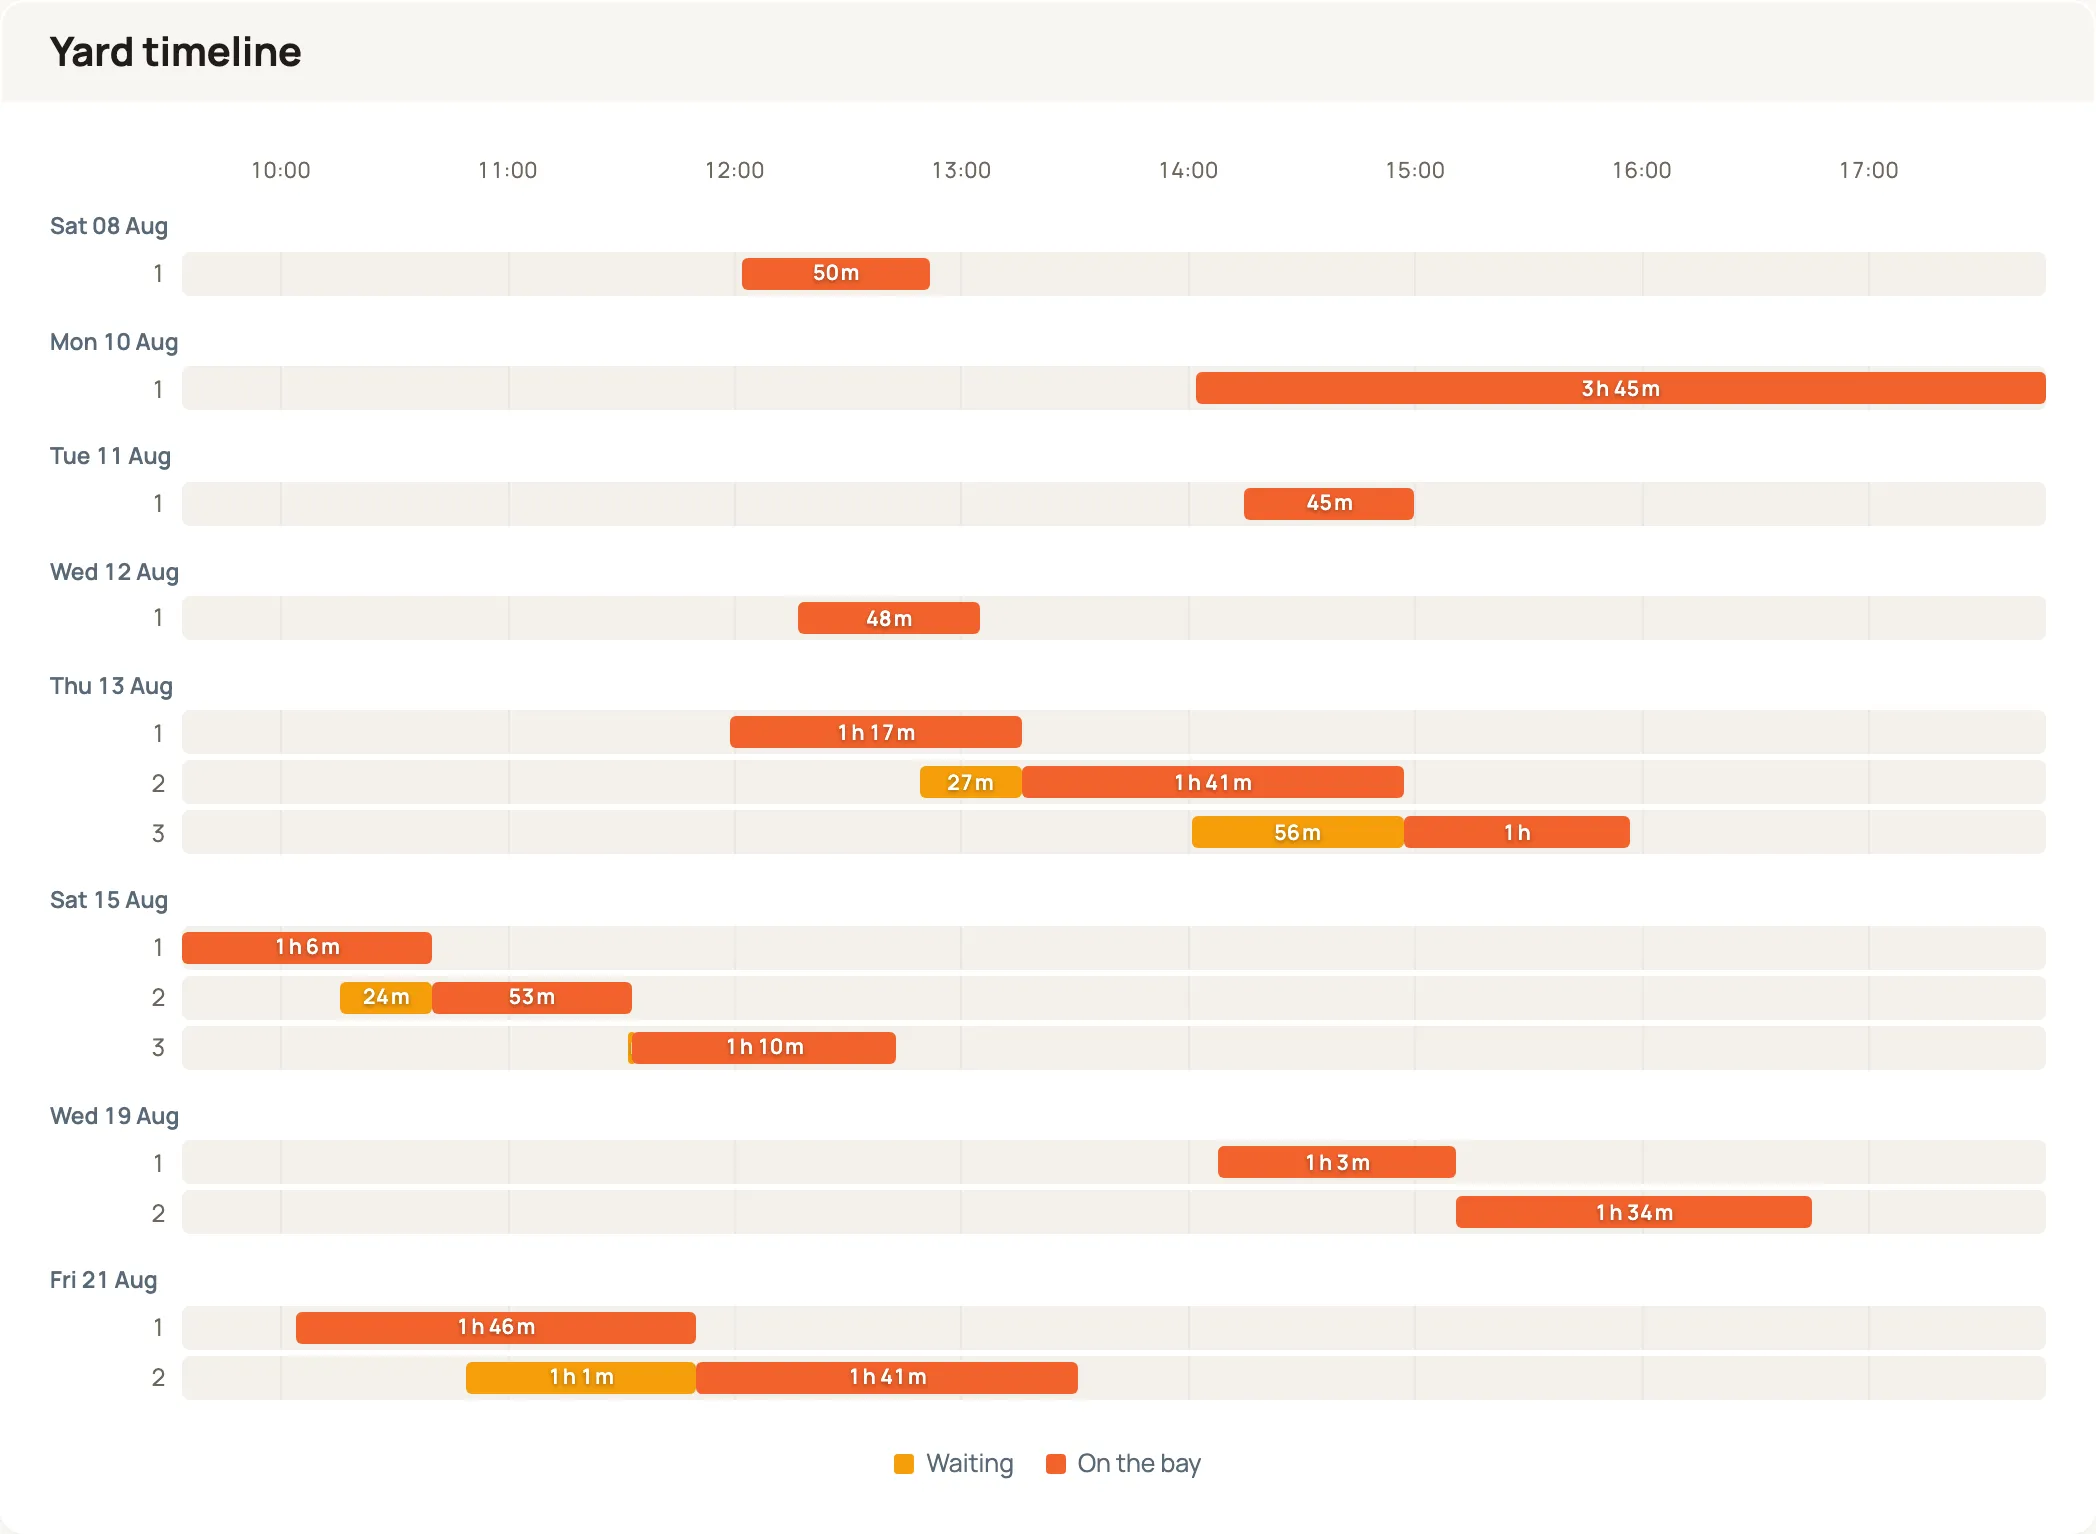
Every band shares the same clock — 10:00 to 17:00 here — so the quiet days and the busy ones are directly comparable.
An interval with no length is not drawn. A truck that rolled straight onto the bay did not wait, and a sliver labelled “0 m” would say that it did.
A row that has started and not finished still gets drawn. A truck on the bay right now is usually the most interesting row on the chart, so it is drawn up to the current time and fades out on the right instead of getting a square edge — “17:53, still going · 42 m so far”. But only for today. Once the day is over, an interval with no end is no longer something in progress; it is a record whose end was never captured. Those keep their start, fade out the same way, and state no duration at all — the tooltip says “no end recorded”, because that is the whole of what is known. Without that distinction a truck that took the bay at 17:53 reads as having stood there for eighteen hours overnight.
How many at once — the overlap count
Section titled “How many at once — the overlap count”The timeline shows one day in detail. How many at once answers the same question at the other scale: when are we busy, across weeks?
It looks like an ordinary stepped line, but the arithmetic underneath is different, and this is the part worth understanding. Grouping a date column counts rows whose start falls in each bucket — “trucks that arrived between 12 and 13”. A truck on site from 11:59 to 13:16 belongs to the 12:00 and the 13:00 hour, and a group-by files it only under 12. No amount of filtering fixes that; it is the wrong arithmetic for the question.
So this shape sweeps the range instead, and reports the most that were in flight at any moment inside each step. Step by hour, day, or week.
Two series make it say everything at once:
| 11:00 | 12:00 | 13:00 | 14:00 | 15:00 | |
|---|---|---|---|---|---|
| On site | 1 | 2 | 2 | 2 | 1 |
| On the bay | 1 | 1 | 1 | 1 | 1 |
Two trucks on site while only one is on the bay. The gap between the lines is the queue — the same fact the timeline shows one truck at a time, now readable across a fortnight.
Two details that matter when you read one:
- Each step reports its peak, not its first instant. A daily step that sampled midnight would report an empty yard every day.
- A handover is not an overlap. Something ending at exactly 14:00 is not still there at 14:00, so a clean handover does not read as congestion.
The range — a price ladder
Section titled “The range — a price ladder”Every other shape reduces a slot to one number. A range keeps two things about it: where the values sit, and how far they spread. For each slot along the bottom and each series it draws a dot at the average of a number column and a whisker from the smallest to the largest value of that same column in that slot.
Each series names one number column, narrowed by its own filter — there is no measure to pick, because the shape has already said what it measures. Two series sit side by side inside each slot, each in its own colour, so a pair reads as a pair.
A worked example: regular and promo prices
Section titled “A worked example: regular and promo prices”A table holds one row per observed shelf price: the product, whether the price was a promotion, and the price. The range has two series over the price column:
| Series | Where |
|---|---|
| Regular price | price type is off-promo |
| Promo price | price type is on-promo |
Order the axis by value and the products line up cheapest first, ranked by the first series’ average — the regular price. (A range never ranks by a column total: a regular price plus a promo price is not a price.) A product with no regular price at all has no rung on the ladder and goes to the end.
Now the question a pricing lead actually asks is visible without reading a number: where does a pricier product’s promo dot dip below a cheaper product’s regular dot? That is where a shopper trades up — and the whiskers show whether it happens on the average or only at the bottom of the promo spread.
Hover a dot or a whisker for its average, smallest and largest value and how many prices stand behind them. A product with only one price in a series draws a dot with no whisker; a product with none draws nothing at all.
Three settings are worth knowing about:
- Draw a line between the slots. On by default here: each product’s slot holds a dot and a whisker per series, offset side by side, and with nothing joining them the line between two products is what says whose promo dot is whose. Untick it for a short ladder where the gaps already say so.
- Start the value axis at zero. A dot is read by position, not length, so a range loses nothing by leaving zero out — and a ladder of 30–90 Kč drawn from zero spends a third of its height on prices nobody charges. Turn it off and the axis rounds out to readable numbers around your prices.
- Around each dot. Nothing — the dot alone drops the whiskers, for a board where the spread is noise and the ranking of averages is the whole message.
The centre is always the average. A median would be the other honest centre, and it is not offered: SQLite has no percentile of its own, and a wrong median is worse than a missing one.
Chart Routario itself
Section titled “Chart Routario itself”Charts are not limited to tables you built. Six platform sources let you chart Routario itself, and they behave like any other source — same shapes, same filters, same measurements, same dashboards:
| Source | What it holds |
|---|---|
| Deals | Your sales pipeline — every deal, its stage, value and owner. |
| Agent runs | Every run of every agent — what triggered it, how it ended, how long it took. |
| Automation runs | Every run of every automation — what started it and how it ended. |
| Events | The event log — everything the system recorded as having happened. |
| Bank movements | Every movement on your connected bank accounts, as the bank booked it. |
| Bank balances | The end-of-day balance of every connected bank account. |
Pick one from New chart on the Dashboards page, under The platform itself.
Because they are ordinary sources, “agent failures per day against a target of 5” is an ordinary bar chart with a target line — not a special report someone has to build. Group by agent, filter to Status is FAILED, bucket by day, add a target. Run durations come from the same start-to-end pair the timeline uses: Started to Finished.
Anyone who can sign in can chart these — the same people who can already open the pages the data comes from.
Charting your bank accounts
Section titled “Charting your bank accounts”Every bank sync keeps the balances the bank sends with it. Bank balances has one row per account per day, in one of two Kinds:
- reported: the bank’s own figure. Every sync brings two, the balance at the start of its window and the balance at the end.
- derived: the opening balance plus that day’s movements, one for every day in between.
So a balance-over-time line has a point for every day, not only the days you synced.
The two kinds must agree on the last day of every sync. When they don’t, a movement is missing or counted twice, and the sync announces it (bank_ingest.balance_mismatch). An automation can be triggered by that event.
You can’t edit Bank movements or Bank balances, because they are the bank’s record. To categorise payments, say which entity they belong to or add notes, open Settings → Apps → Fio Bank and choose Keep as data products. You get two ordinary tables with the same data. Each sync updates the bank’s columns there and locks them against editing. Columns you add beside them are yours, and a sync never touches them.
Charting your pipeline
Section titled “Charting your pipeline”Deals is the one that answers a commercial question rather than an operational one — the deals you already keep in Contacts, drawn: what is in the pipeline, what it is worth, whose it is, and what is closing when.
| Column | What it is |
|---|---|
| Deal | The deal’s name. |
| Stage | Which stage it sits in — your stages, whatever you named them. |
| Outcome | Whether that stage counts as open, won or lost. |
| Company, Owner, Source | Who it is with, whose it is, where it came from. |
| One-time | The one to add up for what deals bring in once. In your workspace’s main currency, converted at the rate recorded when the deal was priced. |
| One-time (as entered) | The one-time figure someone typed, in the deal’s own currency. |
| Recurring (per month) | What deals bring in every month, in your main currency: the recurring figure to add up. It is never added to the one-time amount. |
| Recurring (as entered) | The monthly figure someone typed, in the deal’s own currency. |
| Currency | The deal’s own currency. |
| Expected close, Created, Last updated, Closed | The dates. Closed fills in when a deal reaches a won or lost stage, so it is empty while the deal is open. |
Deals you have deleted are left out, so a board and your Deals page always agree.
Pipeline by stage: use a funnel, not bars
Section titled “Pipeline by stage: use a funnel, not bars”This is the one trap worth knowing about. A bar chart grouped by Stage sorts the stage names alphabetically, because that is what grouping does everywhere else in Routario. With the default stages you get:
Lead · Lost · Qualified · Won
Lost lands second — exactly where you would read the pipeline’s second stage. It is not a pipeline; it is an alphabetical list that looks like one.
Use a funnel instead. A funnel’s steps are yours, in the order you list them, and are never re-sorted — plus you get the two conversion rates and the count lost at each step, which is the whole reason to look at a pipeline in the first place.
Build it as one step per stage, in your order, each counting deals filtered to that stage:
| Step | Filter | Result |
|---|---|---|
| Lead | Stage is Lead | 4 |
| Qualified | Stage is Qualified | 1 |
| Won | Stage is Won | 1 |
Which reads: a quarter of leads get qualified — three fall out there — and everything qualified went on to close. The leak is at the top, and it is named.
Swap the measurement from a count to a sum of One-time and the same funnel shows money moving through the pipeline instead of deal count. Both are worth having; they rarely tell the same story.
Zero and nothing are different
Section titled “Zero and nothing are different”This one is worth internalising, because it is the difference between a chart that reports and a chart that misleads.
If you count rows (or sum them, or count distinct values) and a day has no matching rows, the honest answer is zero — nothing happened, and zero is a measurement. The chart draws a point on the axis.
If you average (or take a minimum or maximum) and a day has no matching rows, there is no answer at all. An average of nothing is not zero; it is undefined. The chart draws nothing — the line breaks, leaving a gap, and there is no point to hover.
So on a chart of “average % of the draft that survived”, a day where nobody replied shows a gap, and a day where replies came back but every draft was rewritten from scratch shows a 0. Those are entirely different facts about your week, and the chart keeps them apart:
| Measurement | No matching rows | Drawn as |
|---|---|---|
| Count, distinct count, sum | 0 | a point on the axis |
| Average, minimum, maximum | no answer | a gap in the line |
Dashboards
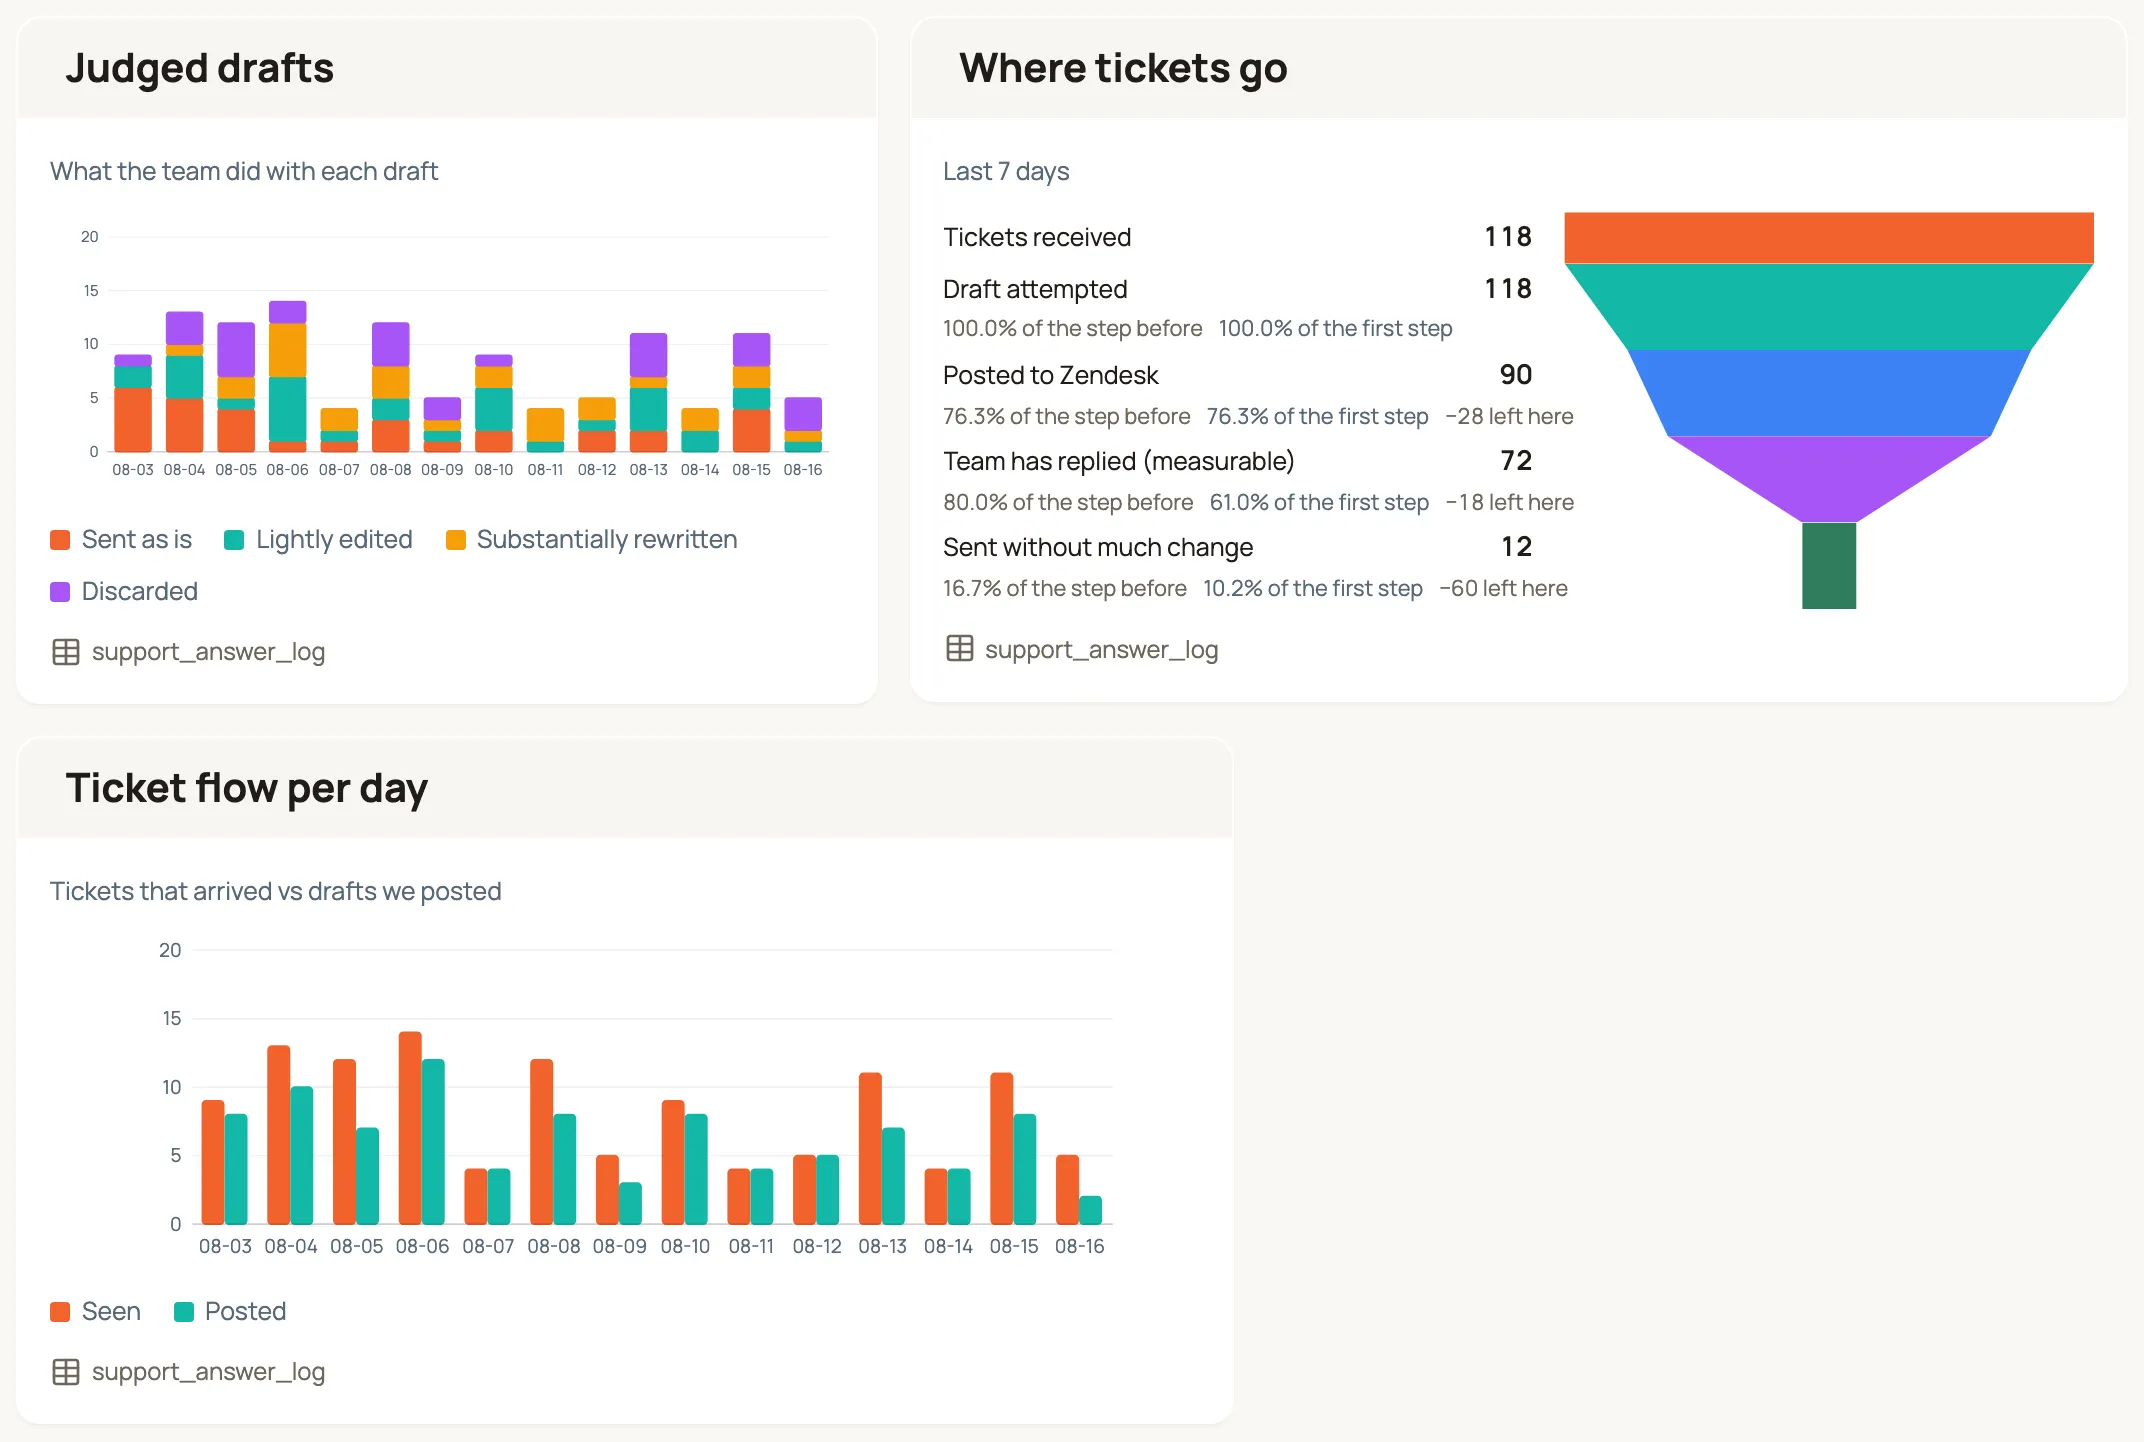
Section titled “Dashboards”A dashboard puts several tiles on one page — a 12-column grid you compose out of things you have already saved. Every tile carries its own title and subtitle and how many of the twelve columns it takes, and it is all rendered on the server, so a dashboard is one page you can read, print, or screenshot with nothing to wait for.
A tile is one of three things:
- a chart — how many, over what;
- a saved table view — which ones. The view is printed as a compact grid: the rows it selects, in its own order, with its own columns and formatting. A row opens its record, and a short list of choices that is yours to answer — a Yes/No verdict, say — is answered right in the tile. “The last ten deliveries” sits beside the charts that count them, instead of being one more page to open. A view whose rows carry coordinates can be drawn as a map instead of a grid — same rows, positioned;
- a note — what any of it is for. A heading over a group of tiles, or a paragraph saying what “good” looks like. See Say what the board is for below.
A board opens with its shape first — every tile in place with its title, and a quiet grey placeholder where each picture will be — and the pictures fill in a moment later, in reading order. A large board no longer waits for its slowest chart before showing you anything. If a tile says it could not be loaded, reload the page; the others are unaffected.
Find them under Data → Dashboards, or as the Dashboard tab on a Job — a Job’s board sits beside its Observe and Configure tabs, which is where a dashboard usually belongs: next to the work it describes.
Making one
Section titled “Making one”Press New dashboard. That is the whole step — there is no form and nothing to fill in first.
You land on the empty board with its name already selected, waiting for you to type. Name it now if you know what it is; ignore it and carry on if you don’t. A board you never name is called Untitled dashboard and works exactly like any other.
This is deliberate. A board’s name is the thing you know least about it at the moment you make one, and knowing it is not a prerequisite for anything — so nothing is gated on it. You will often name it properly only after two or three tiles are up and the board has told you what it is about.
The title is the rename control. Click the board’s name at any time — from the empty board or one you built a year ago — type, and press Enter or click away. Clearing it entirely puts the board back to Untitled dashboard rather than refusing; there is no separate settings page and no Rename menu item to find.
Creating a board from a Job works slightly differently: the Job’s Dashboard tab asks for a name up front, pre-filled with the Job’s own name. A Job’s board has an obvious name, so there it is offered rather than asked for.
Putting your boards in order
Section titled “Putting your boards in order”The Dashboards page lists your boards in the order you put them in, so the one people open first — an Executive summary, say — can sit at the front of the area boards it summarises. Drag a board by the grip in its top-right corner and drop it where the coloured bar marks the gap. From the keyboard, Tab to the grip and use the arrow keys, or Home and End to go straight to the front or the back.
The new order saves on its own and a message confirms it, with an Undo. It is one order for the whole workspace, so everyone sees the boards the same way round, and a board you make later is added at the end. Until anyone reorders, boards are listed oldest first. If the list changed in another tab while you were dragging, a board made or deleted there, the order is not saved. The page puts your list back and tells you to reload.
Putting things on it
Section titled “Putting things on it”Add to board lists everything that can go on a board — the two kinds of note first, then your charts, then your saved table views, grouped by what each one reads. Charts and views you have already put up are left off the list, because offering one twice is offering a no-op. A tile lands full width on a new row, and a table view lands two or three rows tall, because a list needs the room a picture does not. Where it goes after that is an arrangement decision, and arranging is a mode with a Save button, so nothing guesses a slot on your behalf.
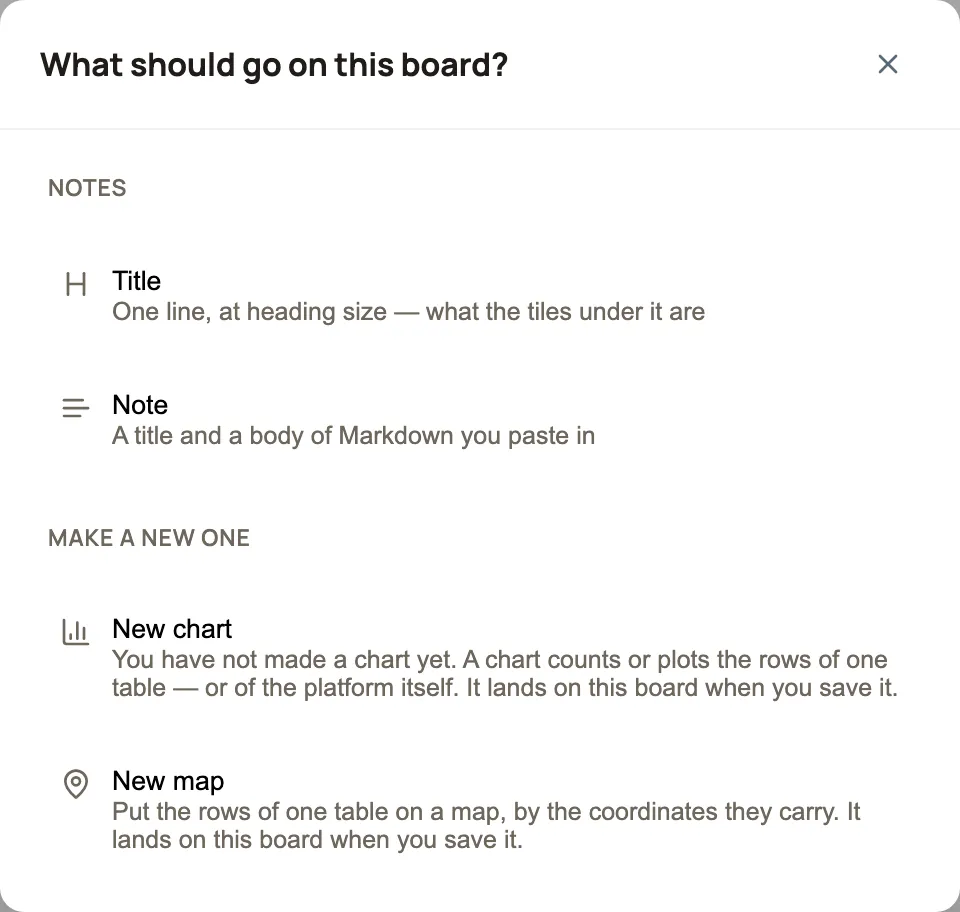
The list ends with Make a new one, which is how a board starts something it does not have yet:
- New chart — asks “What should the chart read?”, the same question the Dashboards page asks, and opens the chart editor on whichever source you pick.
- New map — puts the rows of one table on a map, by the coordinates they carry.
Either way, the finished thing lands on this board when you save it. You already said where it goes by starting it from here, so you are not asked again and there is nothing to go back and place by hand. Cancel returns you to the board, not to the table you happened to pick.
That matters most on a brand-new board, where there is nothing saved to add yet: the picker offers notes, a chart, and a map from the first moment, so an empty board is a starting point rather than a dead end.
From the other direction, both have an Add to dashboard button of their own — on a chart’s page, and on the line describing an open saved view — listing your boards. A board the chart or view is already on shows as a link to go and look at it rather than a button to add it twice.
Arranging
Section titled “Arranging”Arrange turns on drag-and-drop. Grab a tile by its header, move it, resize it from the corner, drop it, and press Save layout. Nothing changes until you save, and Cancel puts it back.
A tile may sit anywhere free — not just at the end of a row — so the space under a short tile is usable like any other. Charts re-draw as you resize, so a chart given more height fills it while you are still dragging: the layout you see while arranging is the layout you get. A table tile given more height simply shows more of its rows.
The controls float at the bottom of the screen rather than sitting in the page header, so on a long board Save is still there when you have scrolled to the tile you wanted to move.
The tile menu
Section titled “The tile menu”Every tile has a ⋯ menu at its top right:
- Edit this chart — one click to the editor, from the place where you noticed something was wrong. It returns you to this dashboard when you save, not to the chart’s table.
- Open — the rows behind the number, in a new tab. A claim you cannot trace is a claim worth doubting, and this is how you trace it.
- Open this view — a table tile’s single verb, because for a view those two are the same page: the view on its table, where you change what it shows.
- Edit this note — a note’s single verb. It opens the same box you typed it into, with the words already in it. A note has no page of its own to go to, because it exists only on this board.
- Take this off the dashboard — while arranging. It removes the tile, never the chart or the view, and it asks first. Like every arrangement change, it takes effect on Save.
Say what the board is for
Section titled “Say what the board is for”A board full of charts tells you what the numbers are. It does not tell anyone what they are supposed to do about them — and six months later, that includes you.
A note is a tile that carries words instead of data. Two kinds:
- Title — one line, at heading size, to sit above a group of tiles and say what the group is. It has no box drawn around it, because a heading that looks like a card reads as one more tile rather than as the label for the ones underneath it.
- Note — a title plus a body you write, for the sentence or three that says what “good” looks like: “The number that matters is time to first pickup, not total volume. Under 2 days is good; over 4 we call the depot.”
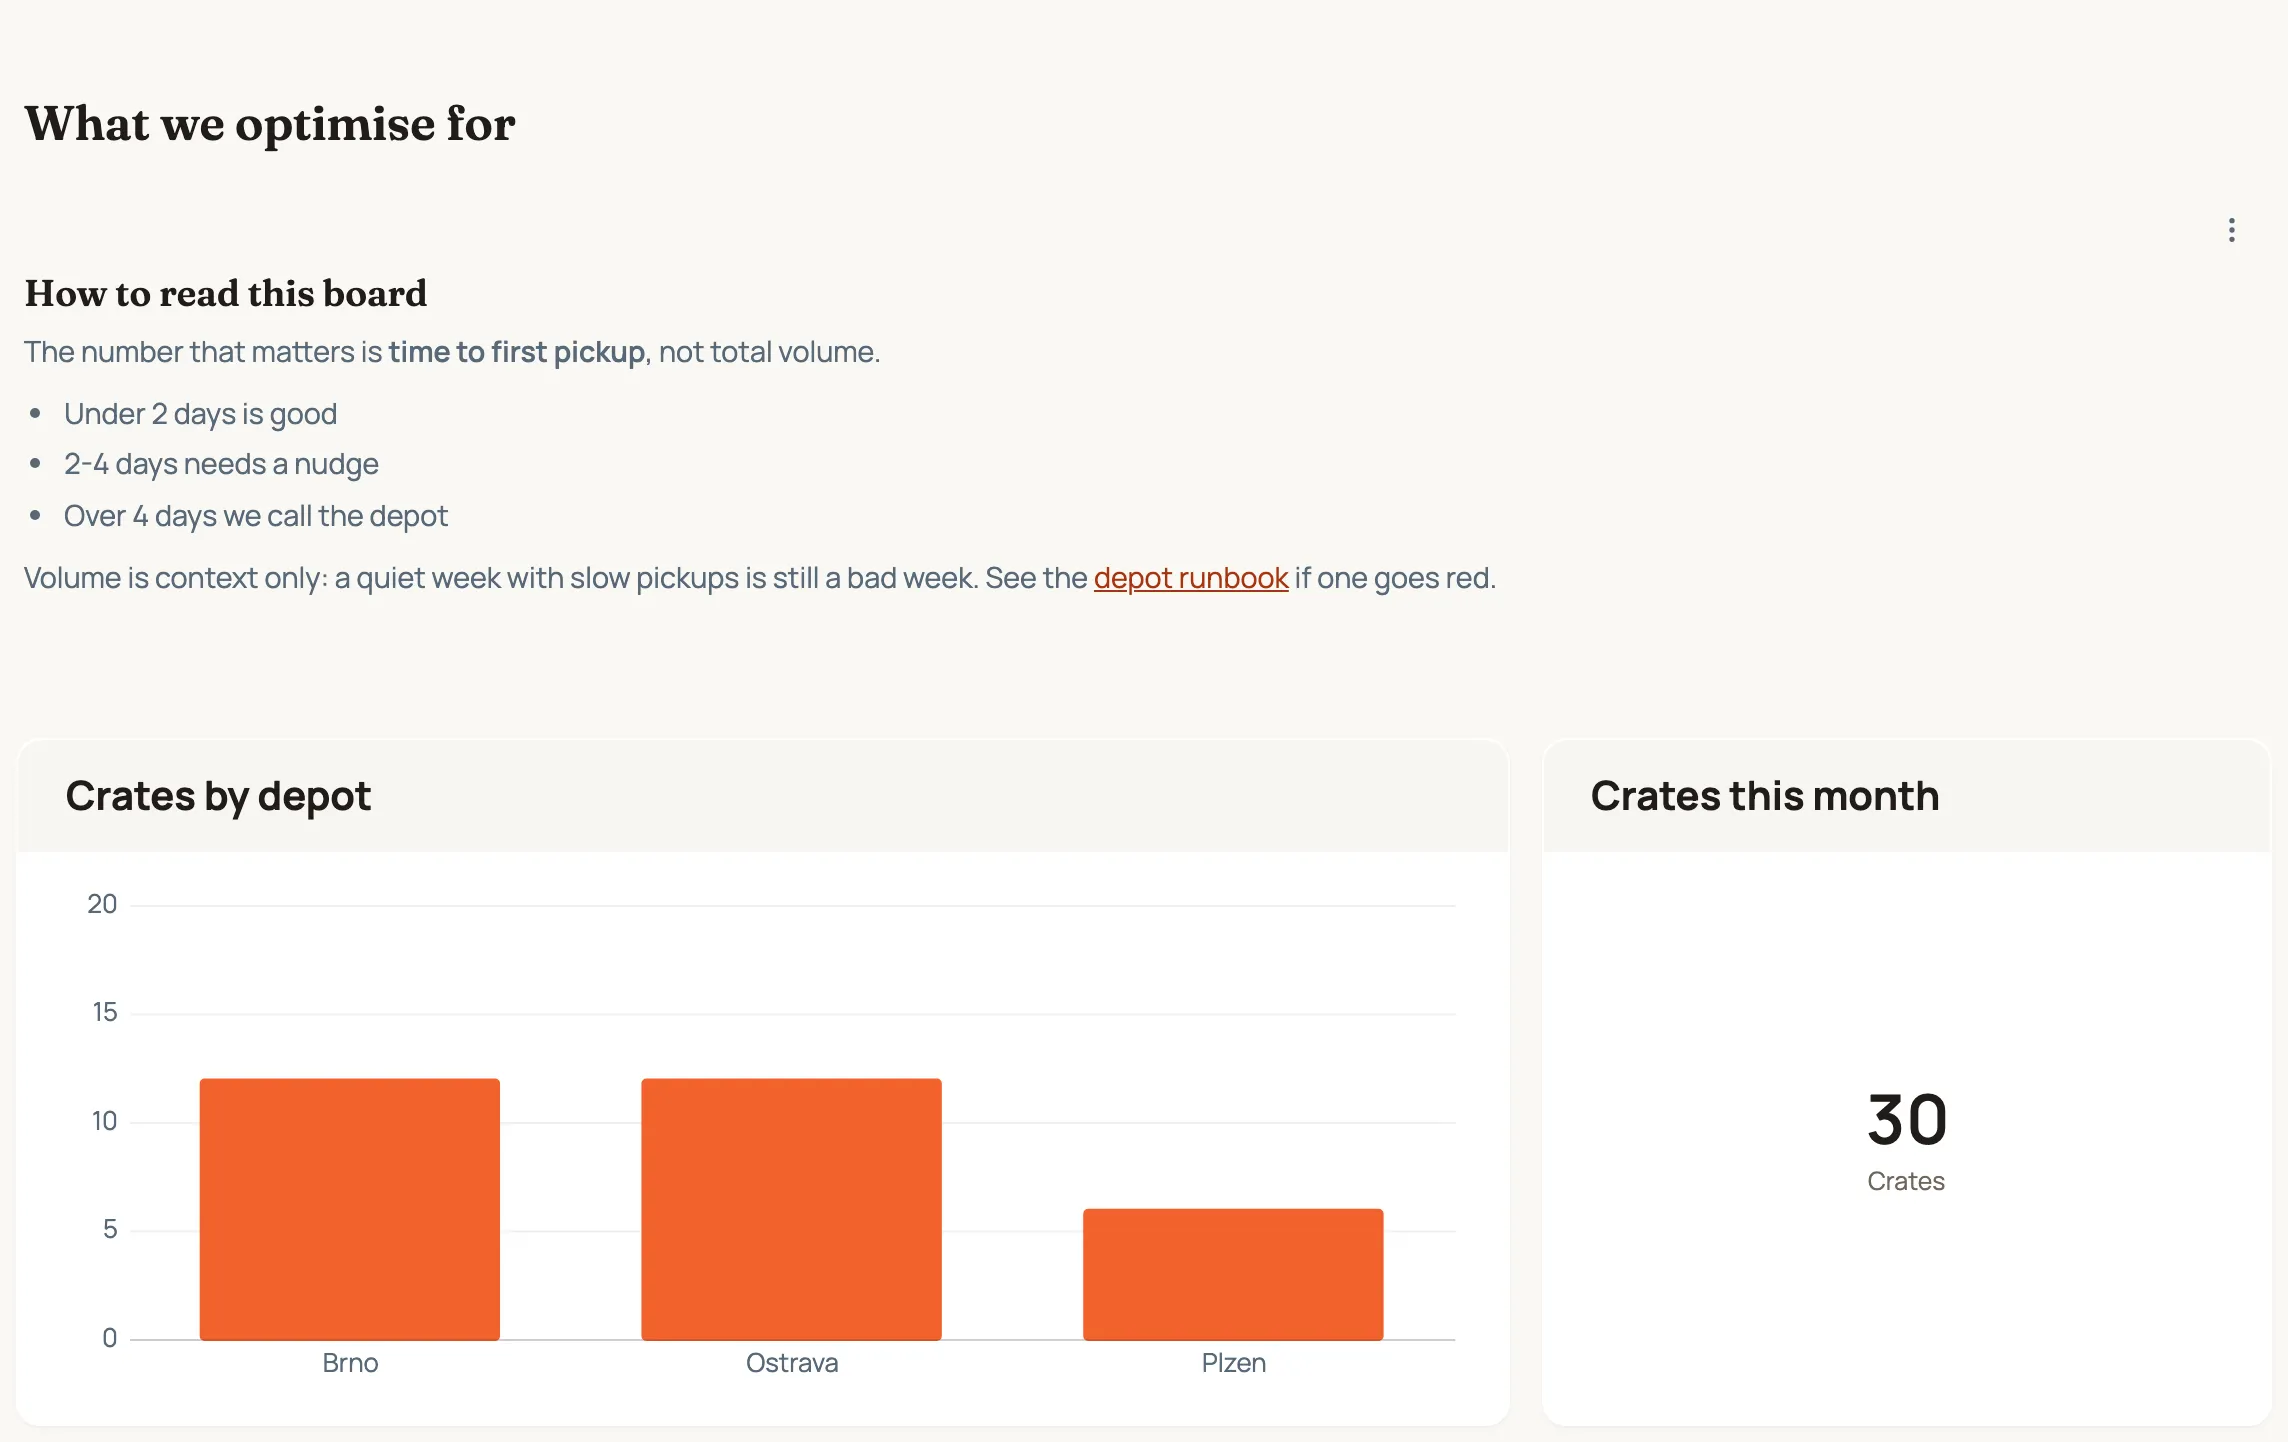
Notes carry no card, and the charts below them do. That difference is the point: a heading and its explanation sit at a different level from the tiles they are about, so the eye reads them as the label for the board rather than as two more tiles on it.
Add one from Add to board — notes are listed first, above your charts and views. They are also the one thing on that list that is always available: you can only add a chart you have already built, but you can always add a heading, so the picker is never empty.
A Title lands one row tall and a Note three, because that is about a short paragraph. Drag either taller like any other tile.
Writing the body
Section titled “Writing the body”You paste Markdown, and the board renders it. There is no editor, no toolbar and no formatting buttons — just a box you put text into. If you have written the paragraph somewhere else already, paste it in and you are done.
What renders:
You type You get **bold**or__bold__bold *italic*or_italic_italic `code`inline code - one/1. onebulleted and numbered lists # A headinga heading ( ##and###step down from there)> quotedan indented quote ---a dividing line [the runbook](https://example.com/runbook)a link, opening in a new tab [Promo board](/glance/…)a link to another page of Routario, opening in place a pipe table (see below) a table Five things worth knowing before you paste a long one:
- Two kinds of link. A full web address (
https://…,mailto:…) opens in a new tab. A path inside Routario — anything starting with a single/, such as[Promo board](/glance/<id>)or[Stock by store](/tables/stock?tab=by_store)— opens in the same tab, like every other link in the app. Copy the path from your browser’s address bar, from the/after the domain onwards. Anything else (a bareorders, or//somewhere.com) is left on the page as plain text. - Tables are written the GitHub way — a header row, a separator row of
dashes, then one row per line. A colon on the right of a separator
(
---:) right-aligns that column, which is what you want for numbers. Images don’t render: if you want a picture, that is a chart. - In the PDF, a link is its words. An exported board keeps each link’s
label and drops the address, so
[Promo board](/glance/…)prints as “Promo board”. A table prints as a table. - Headings sit under the note’s own title, so a
#looks smaller than it would in a document. The note already has a heading — these are for sub-headings inside it. - HTML is shown, not run. Anything that looks like a tag arrives on the page as visible text. You cannot break the board with a paste, which is the point: pasting from somewhere else is the normal way to use this.
A title can run to 200 characters and a body to 10,000 — about two pages. A note longer than that is a document, and a board is not where a document goes.
What a note is, and is not
Section titled “What a note is, and is not”A note belongs to its board. It is not a chart, it reads no table, and it does not appear in any list of things you can reuse. Put the same words on two boards and they are two notes; delete the board and they go with it. That is deliberate — a heading that said “Q3 priorities” on the board you wrote it for would be worse than useless on someone else’s.
You cannot change a Title into a Note or the other way round. They are different sizes and read differently, and switching one silently would resize your tile and hide a body you could no longer see to fix. Making the other kind takes one click.
Notes come out in the PDF export as words, not as a picture of words — so they stay selectable and searchable in the document, and a note that titles a group of charts titles that same group in the report.
Taking the board with you
Section titled “Taking the board with you”Export PDF, in the page actions, downloads the whole board as one branded A4 document: every chart drawn as it appears on screen, every table tile as a real table, every note as the words you wrote, in board order, dated at the top. Nothing is stored — the file goes straight to your computer.
Use it for the meeting nobody logs in for, or the client who wants last month on paper. A tile that could not be drawn — a deleted chart, a tile with no data yet — is named at the end of the document rather than leaving a silent hole, because a missing tile reads as a zero.
If you want it to arrive without anyone pressing anything, the same document goes out on a schedule: Email a dashboard every morning.
What a table tile shows
Section titled “What a table tile shows”Exactly what its view shows, and nothing more. Same rows in the same order, same columns, same date and number formatting — it runs the saved view rather than re-deriving it, so the tile cannot disagree with the table page it came from.
It has no filters, no sorting and no paging of its own: those are the view’s, saved on the table page. It prints at most 25 rows, and when the view holds more it says so (“Showing 10 of 37”). To change what a tile shows, change its view.
What a map tile shows
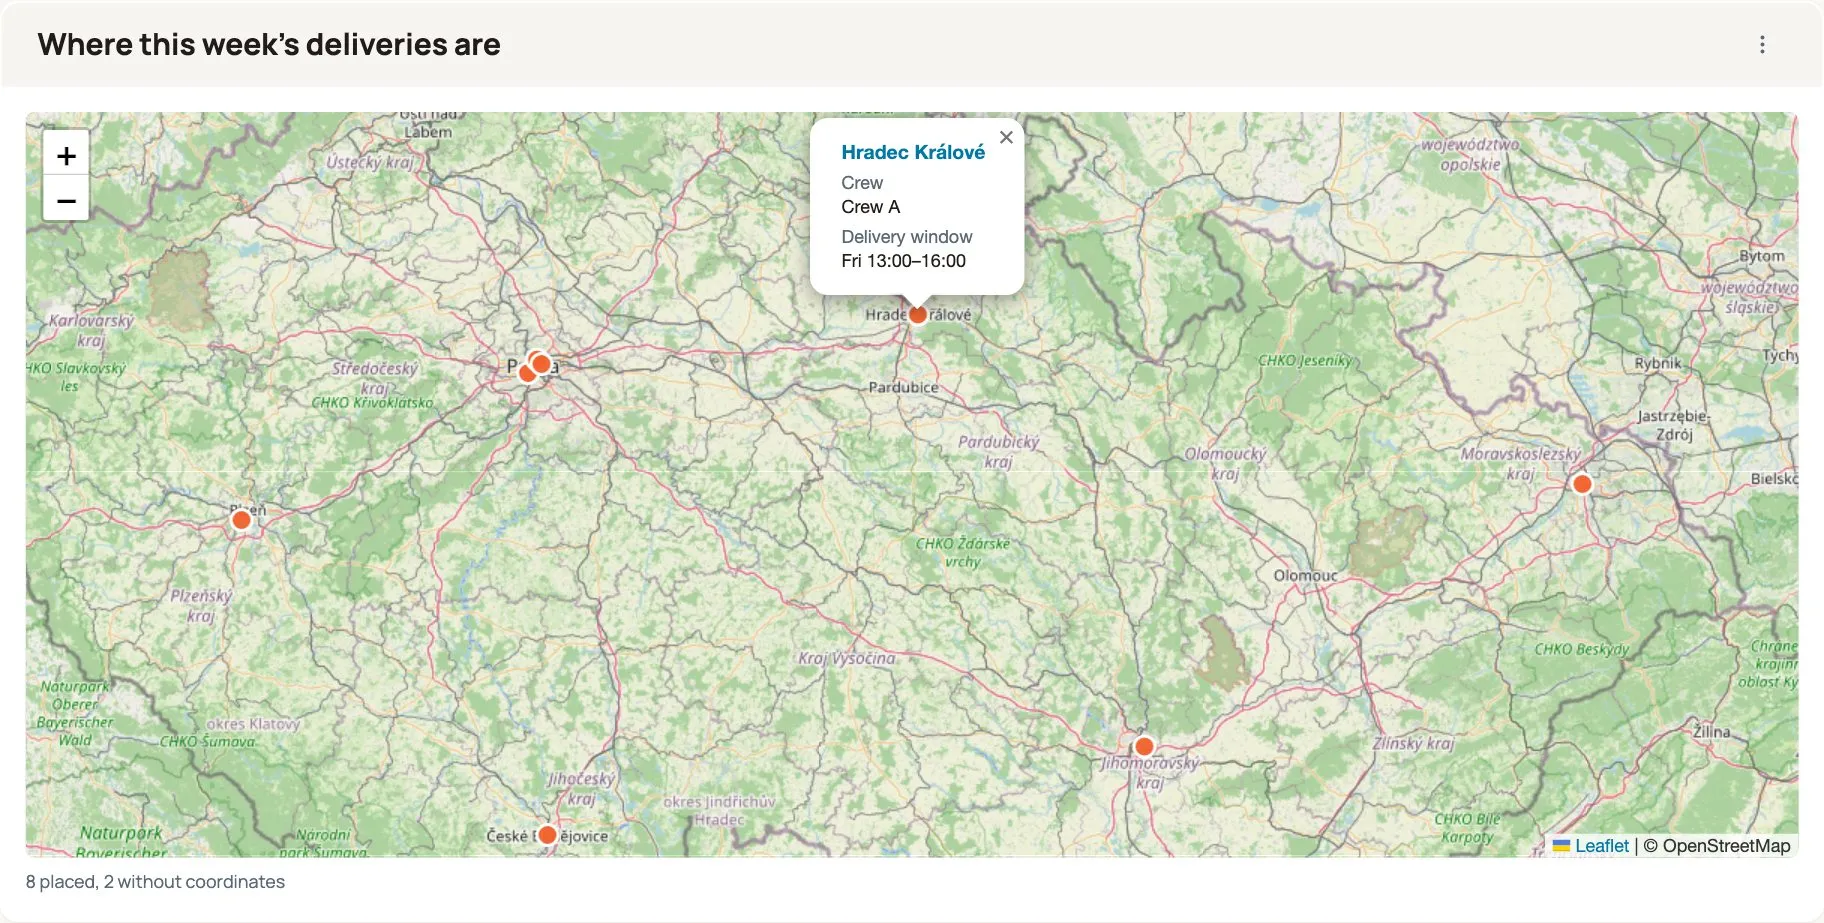
Section titled “What a map tile shows”Some tables answer “how many” and some answer “where”. A list of sites, projects, deliveries or visits is not really a list — it is a picture of a region, and reading it as rows means holding the geography in your head. A map tile draws a saved view’s rows as pins instead.
It is the same view, read the same way. Same filter, same sort, same row cap — so a map and the table page it came from can never disagree about which rows count. Dates and numbers in the pin popups are formatted by the view, not re-formatted by the map.
Click a pin and you get its popup: the row’s first column as the heading — a link straight to the row — and up to six more of the view’s columns underneath, each trimmed at 90 characters. The heading column is not repeated in the list below it, so a popup says six things rather than five and an echo.
The map fits itself to your pins when the board loads. Pinch to zoom — on a trackpad or a touchscreen — or use the + / − buttons, and drag to pan. An ordinary scroll is deliberately left alone: a map that grabs the page scroll as you pass over it is the single most irritating thing on a dashboard, so scrolling past a map scrolls the board, and only a pinch zooms.
What a table needs to be mappable
Section titled “What a table needs to be mappable”Two ordinary number columns holding a latitude and a longitude.
latandlonare the names Routario expects, and a table that uses them needs no setting up — but any two number columns will do, and you say which in the step above:Column key Type Example latNumber 50.0866lonNumber 14.4636Plain numbers, deliberately — not a special “place” type. A coordinate you can read in a spreadsheet, sort in a table, export to CSV and paste out of a mapping site is one that every other tool you own already understands.
Where the numbers come from is up to you — a map does not care how a row got its coordinates, only that it has them. In practice they arrive one of three ways:
- They come with the data. Plenty of systems already store coordinates, so rows imported from a CSV or synced from another tool often arrive mappable and there is nothing to do. This is the common case whenever the source system knew about places.
- You geocode an address. When rows carry an address but no coordinates, a flow with a Geocode step turns one into the other. It writes exactly
latandlon, so a table filled this way needs no setting up at all. - You type them in. For a handful of fixed sites — depots, branches, yards — pasting a pair out of a mapping site is faster than automating anything, and they never change.
The column names are not forced precisely because of the first case: a table that existed before you wanted a map of it may already store
latitudeandlongitude, orgps_lat, or something else entirely. Renaming a column your other flows read would be a silly price to pay for a map.Making one
Section titled “Making one”From the board: Add to board › New map, then pick the table. You get one short confirmation step before it lands.
Where the pins go. The two coordinate columns, guessed from your column names and shown already picked —
lat/lon,latitude/longitudeand a few others are recognised. Change them if the guess is wrong. It asks rather than just doing it because a wrongly-picked column draws a pin that looks exactly as convincing as a right one.What a pin says. Tick the columns the popup should show. The first one you leave ticked becomes the heading, so put the name of the thing first — a map of identically-labelled dots is a map of nothing. The two coordinate columns are never offered here; a pin repeating the numbers that placed it says nothing.
Save, and it is on the board — drag it to the size you want and save the layout like any other tile.
What you have made is a saved view that draws as a map, so it appears on the table page too and everything a view can do applies to it. To show only some of the rows, filter that view.
It tells you what it could not place
Section titled “It tells you what it could not place”A map that quietly draws nine of sixteen rows is worse than no map, because nine pins look like all of them. So under the map you get a line like:
6 placed, 2 without coordinates
A row counts as without coordinates when
latorlonis empty, when either is out of range (a mistyped longitude of1445is not a place), or when both are exactly zero — which is what a failed geocode leaves behind, and which would otherwise draw a convincing pin in the Gulf of Guinea.One tile draws at most 2,000 pins. If your view’s own row limit is lower, that wins.
Zoomed out, it counts instead of smearing
Section titled “Zoomed out, it counts instead of smearing”Five hundred pins over a country is one orange smear — you cannot tell one city from another, and the number that actually answers “where is the work” is the one thing the map cannot say. So pins that sit close together at the current zoom are gathered into a counted bubble: one circle reading
107, not a hundred and seven overlapping dots. Zoom in and the bubbles split; click one and the map zooms to what is inside it; get close enough and you are back to individual pins and their popups.The bubbles are sized by how much they hold, not coloured by it — a busy city is a bigger circle, not a redder one, because more work in one place is not a warning.
This happens in your browser rather than on the server, which is why zooming and panning are instant: every pin is already there, so nothing is fetched as you move. That is also the reason for the 2,000 cap — the pins travel with the page.
An empty map and an unmappable one look identical on screen, so they say different things:
- “No rows with coordinates to place.” — the view works, nothing matched. Widen the filter.
- “This view has no lat and no lon column…” — the view can never draw, and the message names the two columns to add. A summarized view gets its own version: totals per bucket have no location, so there is nothing to place.
About the background map
Section titled “About the background map”The map imagery comes from OpenStreetMap and is fetched by your browser, not by Routario. If you self-host on a machine with no outbound internet, the pins, popups and links all still work — they just sit on a plain background instead of streets. That is a real trade and worth knowing before you promise someone a map: positioned dots with names on them still answer “where are these”, which a list never does.
What a dashboard is not
Section titled “What a dashboard is not”A dashboard is a glance surface, deliberately:
- No filters, no date pickers, no drill-downs. A tile shows what its chart or view is defined to show. If you want a different slice, that is a different chart or a different view — either takes about a minute to make.
- No joins. Every chart and every view reads one table.
- No cross-tile interaction. Clicking one tile does not filter the others.
This is a choice, not a gap. A board where every tile has its own controls is a board nobody can read at a glance, and where two people looking at the same URL see different numbers.
What charts don’t do
Section titled “What charts don’t do”Charts sit on the same deliberately-thin layer as views, and inherit the same limits: one table, filters combined with AND only, no lookups into other tables.
What they deliberately don’t do is arithmetic. A chart counts, sums, averages, and formats — it will not turn two columns into a percentage for you. That belongs on the row, not in the chart, so that every chart, view, export and automation reading that table sees the same number: add a calculated column and then plot, group, or average it like any other column.
If your question crosses one of the remaining lines, the answer is the same as it is for views: build a flow that pulls from wherever the data lives, combines it, and writes the result into a table — then chart that table like any other.
Where to go next
Section titled “Where to go next”- Filter, group, and summarize a table — the numbers behind the picture, and the bucket families in more detail.
- Working with data: tables and imports — creating tables and getting rows into them in the first place, including the
latandloncolumns a map tile reads. - Email a dashboard every morning — put the board on a schedule: every tile in a branded PDF, in someone’s inbox. A note goes into the report as words, and into an agent’s reading of the board as your standard for what good looks like.
- Jobs — where a dashboard usually lives: beside the work it describes.
- Working with Contacts — where deals come from, and the stages a pipeline funnel reads.
- Keeping automations healthy — what the agent and automation run records mean, once you start charting them.