

Email a dashboard every morning
A dashboard answers the question in a second, but only for someone who remembers to open it. The people who most need the numbers — a site manager, a client, your own boss — are usually not the people who log in every morning.
So send it to them. This guide builds a flow that, every morning at eight, draws each tile of a dashboard, renders them into a branded PDF, and emails it with a link back to the live board. It takes four steps and no code.
The link matters as much as the PDF. A PDF is a fact about yesterday; the link is somewhere to go when the fact raises a question.
Before you start
Section titled “Before you start”You need a dashboard with at least one tile on it, and its slug — the short name in the address bar when you open the board under Data → Dashboards. A board called Deliveries usually has the slug deliveries.
The four steps
Section titled “The four steps”| # | Step | What it does |
|---|---|---|
| 1 | Schedule (Cron) | fires the flow every morning |
| 2 | Snapshot dashboard | draws every tile and hands on a ready-made document |
| 3 | Render document | turns that into a branded PDF |
| 4 | Send email | attaches the PDF and sends it |
Create a new automation, then add them in order, connecting each to the next.
1. Schedule (Cron)
Section titled “1. Schedule (Cron)”Set the trigger to Schedule (Cron). Pick a preset, or write the expression yourself:
- Expression —
0 8 * * *(every day at 08:00) - Timezone —
Europe/Prague
Set the timezone explicitly. Without it the schedule runs on UTC, which drifts an hour away from your morning twice a year.
2. Snapshot dashboard
Section titled “2. Snapshot dashboard”This is the step that pulls the board off its page.
- Dashboard —
deliveries(the slug, or the board’s id) - Heading —
Deliveries — {{ now.date }}
Give the step the label board, so later steps can refer to it by that name.
It draws each chart tile as a picture, files those pictures in Memory, and returns a finished document with every tile already placed in it — plus url, a link straight to the live board. A table tile (a saved view on the board) goes in as a table rather than as a picture, and a note goes in as the words you wrote: both are text, and a picture of text is worse to read — you could not select it, search it, or copy a figure out of it.
It does not stop for one bad tile. A tile whose chart or view was deleted, or that has no data yet, is listed in skipped with the reason, and the rest of the report goes out. A quiet hole in a report reads as a zero, which is worse than a missing tile.
3. Render document
Section titled “3. Render document”-
Markdown —
<!-- eyebrow: DASHBOARD -->{{ board.markdown }}Full board: {{ board.url }} -
Language —
English, or whichever language the report is written in -
Title —
Deliveries — {{ now.date }} -
Filename —
deliveries-{{ now.date }}.pdf
Label this step pdf.
Always set Language. It decides the cover page, the date format and how lines break: in Czech and Slovak a one-letter word like “v” never ends a line. Left unset, the step still works, but the document comes out with English rules, and the editor shows a warning until you pick one.
That first line is worth keeping. Without it, the corner of every page reads USE CASE — the default for the sales documents this renderer was first built for, and wrong on a morning report. Set it to whatever the document actually is.
Everything else is ordinary text, so you can write around the charts: a sentence of context above them, a note about what to watch, a footer with who to call.
4. Send email
Section titled “4. Send email”-
To —
you@yourcompany.com -
Subject —
Deliveries — {{ now.date }} -
Body —
Good morning,The Deliveries board is attached as a PDF.See it live: {{ board.url }} -
Attachments —
{{ pdf.document_id }}
Attachments takes the id of a stored file — which is exactly what the previous step handed back. Attachments are capped at about 10 MB in total.
What arrives
Section titled “What arrives”A branded A4 PDF: your heading, then each tile drawn as it appears on screen — bars, lines, the big-number tiles, funnels — each under its own heading, in board order, paginated so nothing is cut in half. The colours are read from the live stylesheet when the picture is drawn, so an exported chart cannot drift away from the one on the screen.
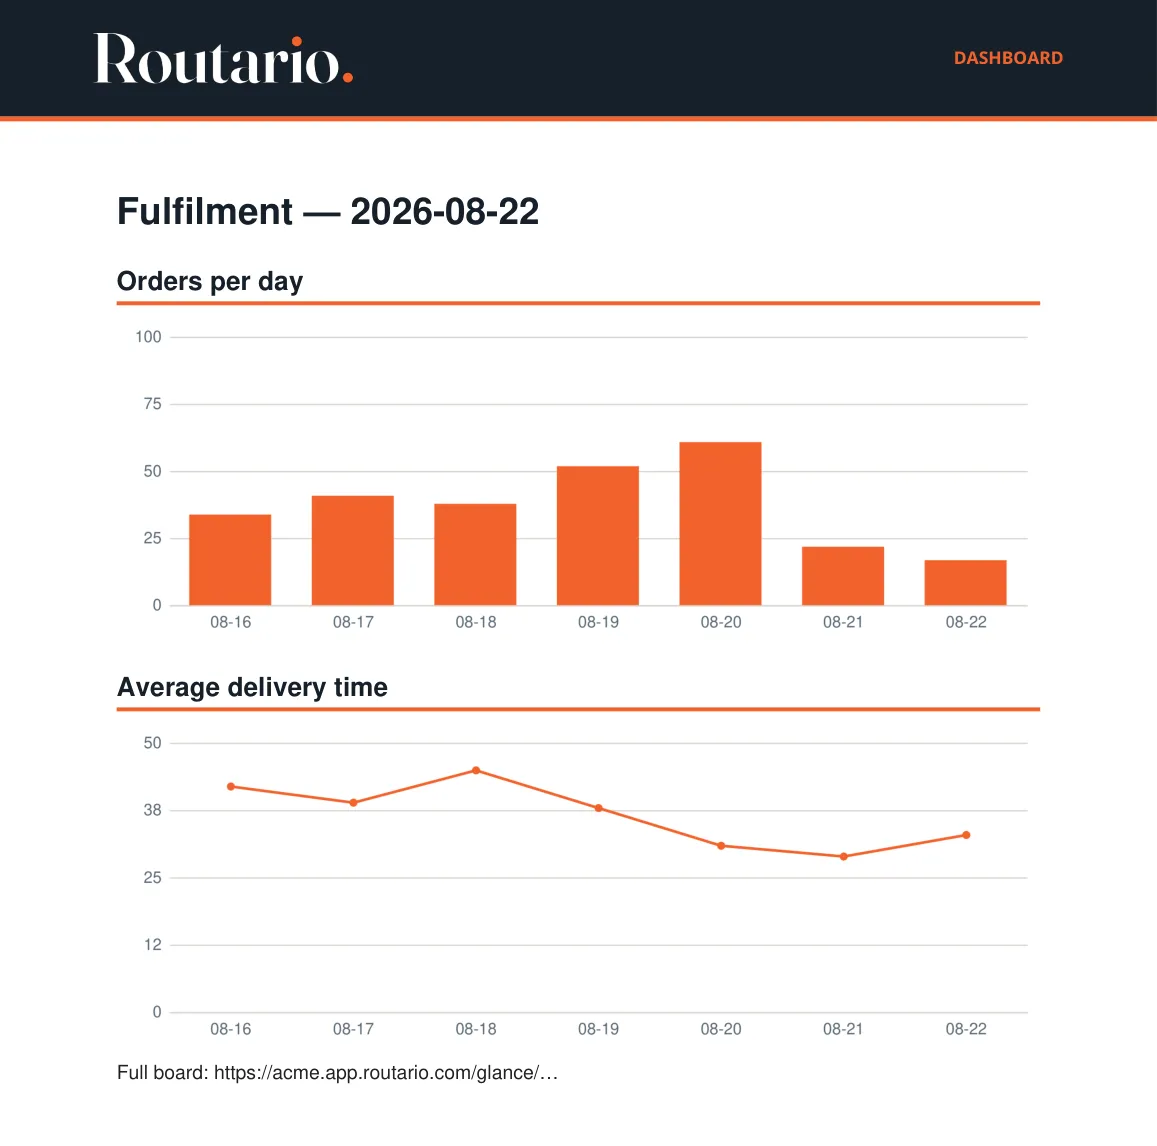
Then the link, and one click back to the real thing.
Reading a dashboard without drawing it
Section titled “Reading a dashboard without drawing it”Sometimes you do not want a picture — you want the numbers, so something can decide with them. That is a different step: Read dashboard.
It takes the same slug and returns the board’s figures as data — a table tile’s rows as rows, and a note as the words you wrote — plus summary, the whole board written out as plain text. Two things it makes easy:
- A threshold. Read the board, then branch on a figure: only send the email when a number crosses a line, so a quiet week stays quiet and an alarming one lands loudly.
- An agent that looks at the board. Hand
summaryto Ask AI — “what changed since last week, and what should I worry about?” — and put the answer in the email above the charts. A note on the board is carried intosummaryword for word, so if you have written down what “good” looks like, the model asked to judge the numbers is reading your standard rather than inventing one. Read dashboard is also available to agents as a tool, so an agent can go and look at a board mid-task without being handed one.
Read dashboard stores nothing. Use it whenever you want the reading rather than the picture.
When it doesn’t work
Section titled “When it doesn’t work”The steps aren’t in the picker. They are in preview — see the note at the top.
“no tile could be rendered”. Every tile was skipped, and the message names each one and why. Usually the board is empty, or its charts and views were deleted.
A tile is missing from the PDF. Check the step’s skipped output. A tile with no data is left out on purpose rather than printed as a blank rectangle.
“document store is not configured”. Memory storage has not been set up on this workspace, so there is nowhere to file the tile pictures. It is configured for you on a hosted workspace; on a self-hosted install, set it up before using this flow.
The email arrives with no attachment. Check that Attachments points at the render step’s document_id and not at the step itself.
Where to go next
Section titled “Where to go next”- Chart a table and build a dashboard — building the board this flow sends.
- Sending email — recipients, carriers, and what to do when delivery fails.
- Keeping automations healthy — knowing whether the eight o’clock run actually ran.